Marten 7.10 was released today, and (finally) brings some built in support for monitoring Marten performance by exporting Open Telemetry and Metrics about Marten activity and performance within your system.
To use a little example, there’s a sample application in the Marten codebase called EventPublisher that we use to manually test some of the command line tooling. All that EventPublisher does is to continuously publish randomized events to a Marten event store when it runs. That made it a good place to start with a test harness for our new Open Telemetry support and performance related metrics.
For testing, I was just using the Project Aspire dashboard for viewing metrics and Open Telemetry tracing. First off, I enabled the “opt in” connection tracing for Marten, and put it into a verbose mode that’s probably only suitable for debugging or performance optimization work:
        // builder is a HostApplicationBuilder object
        builder.Services.AddMarten(opts =>
        {
            // Other Marten configuration...

            // Turn on Otel tracing for connection activity, and
            // also tag events to each span for all the Marten "write"
            // operations
            opts.OpenTelemetry.TrackConnections = TrackLevel.Verbose;

            // This opts into exporting a counter just on the number
            // of events being appended. Kinda a duplication
            opts.OpenTelemetry.TrackEventCounters();
            );
        });
That’s just the Marten side of things, so to hook up an Open Telemetry exporter for the Aspire dashboard, I added (really copy/pasted) this code (note that you’ll need the OpenTelemetry.Extensions.Hosting and OpenTelemetry.Exporter.OpenTelemetryProtocol Nugets added to your project):
        builder.Logging.AddOpenTelemetry(logging =>
        {
            logging.IncludeFormattedMessage = true;
            logging.IncludeScopes = true;
        });

        builder.Services.AddOpenTelemetry()
            .WithMetrics(metrics =>
            {
                metrics
                    .AddRuntimeInstrumentation().AddMeter("EventPublisher");
            })
            .WithTracing(tracing =>
            {
                tracing.AddAspNetCoreInstrumentation()
                    .AddHttpClientInstrumentation();
            });

        var endpointUri = builder.Configuration["OTEL_EXPORTER_OTLP_ENDPOINT"];
        builder.Services.AddOpenTelemetry().UseOtlpExporter();

        builder.Services.AddOpenTelemetry()
            // Enable exports of Open Telemetry activities
            .WithTracing(tracing =>
            {
                tracing.AddSource("Marten");
            })

            // Enable exports of metrics
            .WithMetrics(metrics =>
            {
                metrics.AddMeter("Marten");
            });
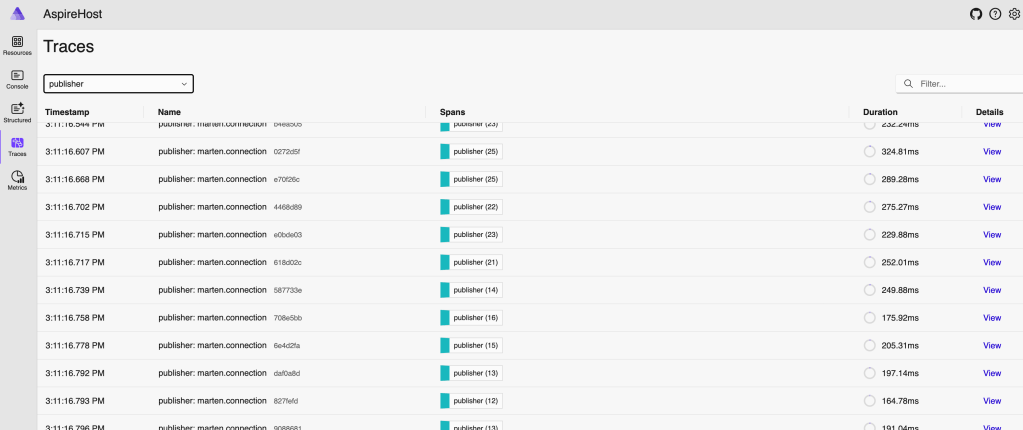
And now after running that with Aspire, you can see the output:

By itself, these spans, especially when shown in context of being nested within an HTTP request or a message being handled in a service bus framework, can point out where you may have performance issues from chattiness between the application server and the database — which I have found to be a very common source of performance problems out in the real world.
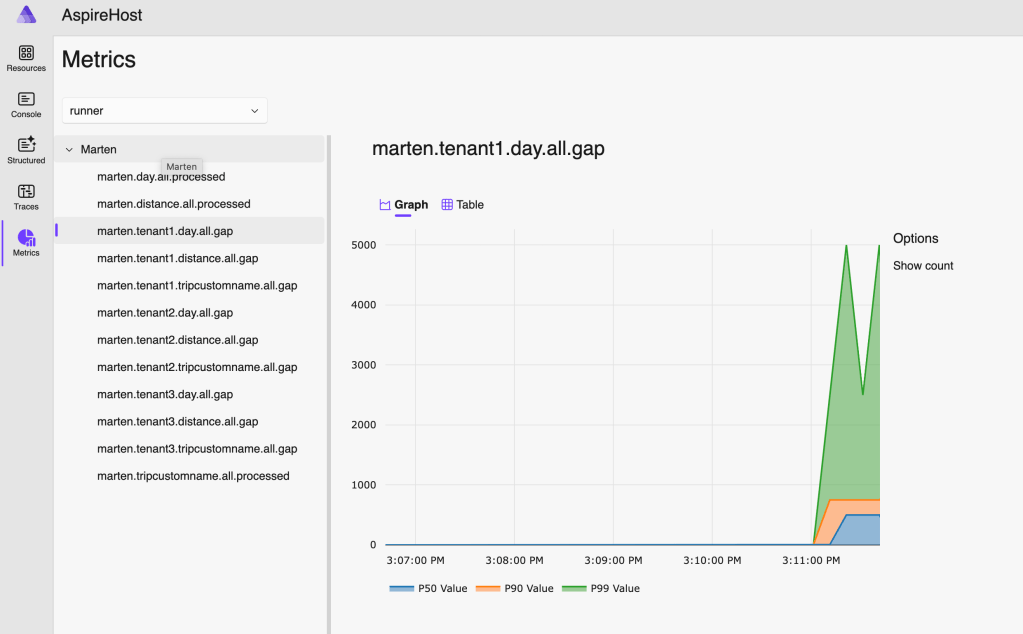
This is an opt in mode, but there are metrics and Open Telemetry tracing that are automatic for the background, async daemon subsystem. Skipping ahead a little bit, here’s a preview of some performance metrics in a related application that shows the “health” of a projection running in Marten’s async daemon subsystem by visualizing the “gap” between the projection’s current progression and the “high water mark” of Marten’s event store (how far the projection is sequentially compared to how far the whole event store itself is):

Summary
This is a short blog post, but I hope even this is enough to demonstrate how useful this new tracing is going to be in this new world order of Open Telemetry tracing tools.
I just tried this out, and it works well! Looking forward to seeing this get extended, hopefully with query times?
I think you could get that OOTB w/ Npgsql open telemetry support, but I havent’ looked into it yet.
Gah, I didn’t even realise Npgsql had OTel support! Just tried it, and it works great in tandem with the Marten telemetry!
Sweet!