Hey Critter Stack folks and JasperFx Software clients, absolutely none of this is set in stone and I’m mostly writing it to elucidate my own thinking, so call this the first pass.
.NET 11 will be publicly available on November 10th. For all of my career as an OSS author, I’ve been deep into my own thoughts and plans and usually caught badly off guard by major new .NET versions. Not this time though! We’re planning to have all the Critter Stack tools release with a .NET 11 target right after .NET 11 itself is officially released.
We’ve had some discussions about this on the Critter Stack Discord about how to address this with a couple choices — but know that we for better or worse do take SemVer pretty seriously:
Add .NET 11 targeting to our current versions and just make a minor version bump but also keep .NET 9 support just to avoid making any breaking changes
Do a major version release of all the major tools, so Marten 10.0 and Wolverine 7.0 for example and now target .NET 10 and .NET 11 across the stack
I’m hesitant to do the major version bump because that’s a lot of work, we just barely made major version releases in late May in our Critter Stack 2026 wave and this feels too soon to do another, and lastly, major version releases come with the pressure to make any breaking changes or consolidations you’ve already been thinking about.
On the flip side, .NET 9 is end of life and many of our dependencies, especially EF Core, are unholy nightmares to support with multi-targeting. And also, I’m tempted to lift the lid and make all those breaking changes and consolidations we’ve already been thinking of doing:)
And no, we’re not going to compromise on SemVer versioning rules. Dropping a .NET version from your support is 100% a breaking change. To paraphrase Winston Churchill, SemVer is the worst versioning system — except for all the others.
I think I’m personally landing on doing the major version bumps to add .NET 11 and drop .NET 9 at the same time. I’m also thinking that if we do that that we’ll make very few breaking changes to make upgrades easy and to back port fixes to the existing version lines at least through January of 2027. That being said, here’s my first thoughts on what new versions mean:
Marten 10, Wolverine 7, Polecat 6, Weasel 10, Fisher 2, JasperFx 3, and we’re going to wait Bobcat 1.0 for .NET 11 now. I’m not sure if Stoat goes 1.0 before Christmas anyway.
CritterWatch 1.2 will support .NET 11 and the newer versions of the other tools as well as being backward compatible with older Wolverine versions
Add .NET 11 support
Drop .NET 9 support
Marten 9.0 fixed what I long considered to be Marten’s “Original Sin” by finally turning the identity map mechanics off by default, so now it’s time to fix Wolverine’s and rewire Wolverine so that there’s a one to one relationship between handler chains and handlers. Gobbledygook to folks not familiar to Wolverine, so let me summarize that as “make Wolverine friendlier to modular monoliths by default“
We’ve identified quite a few opportunities to utilize .NET 11 capabilities as optimizations
Add C# discriminated union support to Marten/Polecat/Fisher because I just know that’s coming as a user request
Try to eliminate more structural duplication between Marten, Polecat, and Fisher. Especially with their respective Wolverine integrations but also for anything else we can
A big time way to dog food Stoat as an agent coordination tool
I don’t think there’s many breaking changes other than some types moving namespaces as part of the consolidation and less so than there was in the previous wave of major versions.
I was giving a version of the workshop on CQRS and Event Sourcing to a JasperFx client today (because that’s something that we do if you’re interested!). In the workshop, I give a little almost digression into Marten’s old document database functionality just to introduce that side of things because Marten’s projections subsystem relies heavily on that same document database functionality. I was speaking to an EF Core heavy crowd and they stopped me to ask questions about Marten’s ability to store and query hierarchies of related types — which is something Marten does very well and has done so for over a decade now.
Most of my time is spent reacting to various problems or trying to fill in the handful of gaps in Critter Stack capabilities, so it was nice to just stop and talk about something that Marten does very well and that’s been so stable for so long that I basically forget about it. Long story short, this functionality is easier and simpler in Marten (or Polecat or Fisher too) than it is with EF Core.
Let’s say you’ve got a Payment concept with a handful of specialized flavors. This is close to the example that Milan Jovanović used in his post on EF Core inheritance mapping back in August, and I’m borrowing it here because it’s about as representative of the “real” problem as anything I could make up:
publicabstractclassPayment
{
publicGuidId { get; set; }
publicdecimalAmount { get; set; }
publicstringCurrency { get; set; } ="USD";
publicDateTimeOffsetCreatedAt { get; set; }
}
publicclassCreditCardPayment : Payment
{
publicstringCardHolderName { get; set; }
publicstringLastFour { get; set; }
}
publicclassBankTransferPayment : Payment
{
publicstringBankName { get; set; }
publicstringAccountNumber { get; set; }
}
publicclassCryptoPayment : Payment
{
publicstringWalletAddress { get; set; }
publicstringNetwork { get; set; }
}
You want to be able to query for “all payments over $100 last week” and get back a mixed bag of concrete types, and you want to be able to say “give me the credit card payments for this card holder” without wading through the bank transfers. That’s not an exotic requirement. That’s Tuesday.
The EF Core way, where you have to pick
If you’re using EF Core, the official inheritance docs give you three mapping strategies, and you really do have to choose one up front because the choice changes your database schema, your generated SQL, and in one case, how your primary keys get generated. Quickly:
Table per hierarchy (TPH) is the default. All four types land in one Payments table with a discriminator column, and every subclass-only property becomes a nullable column that’s NULL on every row of every other subtype:
Table per type (TPT) gives you a Payments table plus one table per subclass joined back to the base by a foreign key. Your schema looks exactly like your class diagram, which is appealing right up until you look at the query plans. Loading “all payments” is a LEFT JOIN per subclass:
Table per concrete type (TPC) gives you one standalone table per concrete class, each with the full set of columns copied in. Polymorphic queries become a UNION ALL across every table. Because there’s no longer a single table to own the identity, EF has to hand out ids from a shared database sequence, and you can’t put a real foreign key on anything that points at “a payment” because a payment’s key might live in any of three tables:
To be fair to the EF team, they’re pretty candid about all this. The modeling for performance page says in so many words that TPT is “in most cases the inferior mapping technique from a performance standpoint,” and their own benchmark loading 35,000 rows across a 7-type hierarchy clocks TPT at roughly double the time and allocations of TPH. Their summary guidance is: use TPH unless you’ve measured a reason not to, use TPC when you mostly query one leaf type at a time, and “use TPT only if constrained to do so by external factors.”
So the recommended answer is “put it all in one table with a discriminator column.” Great! That’s the right answer. Now notice how much ceremony it took to get there, and how many ways there are to get it wrong: nullable sparse columns, HasValue<T>() registrations that have to be kept in sync with your class list, the IsComplete(false) escape hatch for when the database has discriminator values your model doesn’t know about, shared columns between siblings needing explicit HasColumnName() calls, and a migration every single time a subclass grows a property.
The Marten way, where the choice collapses
Marten stores documents (entities) as JSONB in PostgreSQL. There is no column per property, so there is no such thing as a sparse column, and no reason to ever spread a class hierarchy across multiple tables. The whole TPH/TPT/TPC decision tree just isn’t there. One table, one row per document, and a small discriminator column so Marten knows which concrete type to deserialize. Just get things done.
Here’s the entire configuration for the payment hierarchy above:
varstore=DocumentStore.For(opts=>
{
opts.Connection(connectionString);
opts.Schema.For<Payment>()
.AddSubClassHierarchy(
typeof(CreditCardPayment),
typeof(BankTransferPayment),
typeof(CryptoPayment));
});
That’s it. No OnModelCreating(), no IEntityTypeConfiguration<T>, no discriminator values to hand-maintain, no column mapping. Add a property to CryptoPayment next month and nothing in this configuration changes and there’s no migration, because the property just shows up in the JSON. If Payment were a concrete class you’d use the same call, and if you’d rather Marten found the subtypes for you, there’s a parameterless AddSubClassHierarchy() overload that scans the base type’s assembly (I’d use the explicit list in anything with a big assembly, but it’s there). You can read more on the document hierarchies page, including the multi-level case where you want to query against an intermediate type in the hierarchy.
What does the table actually look like? I ran this configuration against PostgreSQL 17 and pulled the shape straight out of information_schema:
column type nullable
id uuid NO
data jsonb NO
mt_last_modified timestamp with time zone YES
mt_version uuid NO
mt_dotnet_type character varying YES
mt_doc_type character varying YES
Same table you’d get for any Marten document (see document storage and metadata), plus mt_doc_type, which is the discriminator. Marten derives the discriminator value from the type name, so the three rows I stored look like this:
No NULL columns for the properties a subtype doesn’t have. Each row carries exactly the JSON for its own type. Marten also drops a btree index on mt_doc_type for you automatically, so narrowing to a subtype is cheap from day one.
One operational note: because the discriminator comes from the class name, renaming CryptoPayment to CryptocurrencyPayment would orphan the existing rows. If you think a subtype’s name might change, pin the alias explicitly with a MappedType and Marten will use that instead of the derived name:
opts.Schema.For<Payment>()
.AddSubClassHierarchy(
typeof(CreditCardPayment),
typeof(BankTransferPayment),
newMappedType(typeof(CryptoPayment), "crypto"));
How LINQ works against the hierarchy
The part I’m proudest of is that querying a hierarchy in Marten is just… querying. You query for the base type and get the whole family back as their concrete types, or you query for a subtype and get only that subtype. Here are the queries and the SQL Marten actually generated for them, lifted from ToCommand() on a real session:
// Every payment, deserialized to its concrete typevar all = await session.Query<Payment>().ToListAsync();
// select d.id, d.data, d.mt_doc_type from public.mt_doc_payment as d;// Polymorphic filter on a base type propertyvar big = await session.Query<Payment>()
.Where(x=>x.Amount>100)
.ToListAsync();
// select d.id, d.data, d.mt_doc_type from public.mt_doc_payment as d// where CAST(d.data ->> 'Amount' as decimal) > :p0;// Just the credit card paymentsvar cards = await session.Query<CreditCardPayment>().ToListAsync();
// select d.id, d.data, d.mt_doc_type from public.mt_doc_payment as d// where (d.mt_doc_type = 'credit_card_payment');// A subtype query filtering on a subtype-only propertyvar mine = await session.Query<CreditCardPayment>()
.Where(x=>x.CardHolderName=="Jeremy")
.ToListAsync();
// select d.id, d.data, d.mt_doc_type from public.mt_doc_payment as d// where ((d.mt_doc_type = 'credit_card_payment') and d.data ->> 'CardHolderName' = :p0);
A few things to notice. Marten selects mt_doc_type alongside the JSON so it knows which concrete type to deserialize each row into, which is how Query<Payment>() hands you back a list with a CryptoPayment, a CreditCardPayment, and a BankTransferPayment in it. Querying for a subtype adds the discriminator predicate for you, and that predicate hits the automatic index. There’s no UNION ALL, no LEFT JOIN chain, and no “shared column” gymnastics, because the subtypes don’t have separate columns.
The same holds for loading by id. LoadAsync<Payment>(id) returns the concrete subtype, LoadAsync<CreditCardPayment>(id) returns the document if it’s a credit card payment, and LoadAsync<CryptoPayment>(sameId) returns null rather than mis-casting somebody’s card into a wallet.
If you need to filter on a subtype’s property while still querying for the base type, there’s a WhereSub<TSub>() operator for exactly that:
vareth=awaitsession.Query<Payment>()
.WhereSub<CryptoPayment>(x=>x.Network=="ETH")
.ToListAsync();
// select d.id, d.data, d.mt_doc_type from public.mt_doc_payment as d// where d.data ->> 'Network' = :p0;
I’ll be honest that WhereSub() is a little bit of a specialty item. It’s really there for the case where you’re composing one query across the hierarchy and want to reach into a subtype’s members; if you just want crypto payments, Query<CryptoPayment>() is the better call. The full list of what Marten’s LINQ provider supports lives under querying with LINQ, and when you want to see what any query is going to do, ToCommand() or ExplainAsync() will show you.
Indexes, including partial indexes against a single subtype
This was a request from a JasperFx client (well, actually a pull request, but hey, that means that we support this going forward if there’s any issues with it).
Now for the part that I think makes the single table approach genuinely better in Marten than TPH is in a relational ORM, and not merely less work.
PostgreSQL supports partial indexes: an index with a WHERE clause, so it only covers the rows that match. Because every subtype in a Marten hierarchy lives in one table with a discriminator column, you can build an index that only covers one subtype, on a property that only that subtype has, and PostgreSQL will keep it tiny and use it when the query’s predicate lines up.
Marten exposes this through the Predicate option on a computed index, and on the index that comes with a duplicated field. Here’s the payment configuration again with two subtype-only indexes added:
opts.Schema.For<Payment>()
.AddSubClassHierarchy(
typeof(CreditCardPayment),
typeof(BankTransferPayment),
typeof(CryptoPayment))
// A computed index on Amount, but ONLY for credit card payments.// Bank transfers and crypto payments never enter this index.
// CardHolderName only exists on CreditCardPayment, so duplicate it// into its own column and index that column, again only for the// credit card rows.
That Duplicate<TSub>() overload is the thing to notice. The docs will tell you that searchable fields are declared on the top type of the hierarchy, and that’s true, but you declare them for a subtype by naming the subtype in the generic argument. Marten adds a card_holder_name column to the table, keeps it populated on write for credit card rows, and leaves it NULL for everybody else, which is exactly the one “sparse column” you actually asked for rather than one per property per subtype.
Here is the DDL Marten generated, straight from pg_indexes:
CREATEINDEX mt_doc_payment_idx_amount
ON public.mt_doc_payment USING btree ((((data->>'Amount'::text))::numeric))
-- Marten adds this one on its own for any hierarchyCREATEINDEX mt_doc_payment_idx_mt_doc_type
ON public.mt_doc_payment USING btree (mt_doc_type);
And because the LINQ provider adds the mt_doc_type = 'credit_card_payment' predicate to every Query<CreditCardPayment>() call, the generated query matches the partial index’s WHERE clause and PostgreSQL picks it up without any extra hinting on your part:
varmine=awaitsession.Query<CreditCardPayment>()
.Where(x=>x.CardHolderName=="Jeremy")
.ToListAsync();
// select d.id, d.data, d.mt_doc_type from public.mt_doc_payment as d// where ((d.mt_doc_type = 'credit_card_payment') and d.card_holder_name = :p0);
Index Scan using mt_doc_payment_idx_card_holder_name on mt_doc_payment d
Index Cond: ((card_holder_name)::text = 'Jeremy'::text)
Note that with the duplicated field in place, the generated SQL switched from data ->> 'CardHolderName' to the real card_holder_name column with no change to the LINQ. That’s the whole point of duplicated fields.
You can do the equivalent in EF Core, for what it’s worth. You’d add HasFilter("[PaymentType] = 'CreditCard'") to an HasIndex() call in your TPH configuration. The difference is that in EF Core you had to have already chosen TPH, already named the discriminator column and its values, and already accepted a nullable column for every subtype property, to earn the right to do it. In Marten it’s one option on an index you were probably going to declare anyway.
What this means for the table
Since this is all one table, everything else Marten does to a document table applies uniformly to the hierarchy:
GIN indexes on the data column cover every subtype at once, which is a cheap way to get “good enough” querying across the whole family before you commit to targeted indexes.
Soft deletes, optimistic concurrency, and the metadata columns (last modified, causation, correlation, and so on) are configured once on the base type and apply to every subtype. You don’t configure deletes three times for three tables.
Table partitioning and multi-tenancy work exactly as they do for any other document, because to PostgreSQL this is just a table.
Growth is linear. Adding a fourth subtype is one more typeof() in the configuration and zero schema changes, because the only new thing in the database is a new mt_doc_type value.
The honest tradeoffs are the same ones TPH carries anywhere. One hot table means autovacuum and bloat are shared across subtypes that may have very different write rates, and you can’t declare a database-level NOT NULL constraint on a subtype-only property (although Duplicate<TSub>() with notNull: true gets you partway there for the fields you care about). If two of the subtypes have nothing in common and are never queried together, they probably shouldn’t be a hierarchy in the first place, and Marten is perfectly happy to store them as two unrelated document types in two tables.
Summary
Marten collapses the table-per-whatever decision down to the one answer the relational ORMs end up recommending anyway, and then makes it close to free: one table, one line of configuration, no ORM mapping, LINQ that already knows about the discriminator, and partial indexes that let you tune for a single subtype without the rest of the hierarchy paying for it. Hierarchy storage has been in Marten since the very early days and I still think it’s one of the quieter wins of putting a document store on top of PostgreSQL.
Questions, war stories, or a hierarchy that doesn’t fit this shape? Find us in the Critter Stack Discord and we’ll talk it through.
Right now things are a bit of a blur just because of the high rate of incoming GitHub traffic we get for the Critter Stack, with Wolverine being the most common recipient of new issues, community pull requests, and JasperFx client requests.
It’s nice to occasionally take a minute and celebrate the project wins whenever they come, and this weekend it’s Wolverine crossing the 10 million download mark (Nuget download statistics are a bit broken right now, but in at least one view Wolverine has 10.2+ M right now).
If you’re not familiar with it, Wolverine is essentially a server side application framework for .NET with a very strong emphasis on low code ceremony, high testability, performance, and (sigh) now AI friendliness. Along the way, Wolverine has answers for usage as:
an asynchronous messaging tool that supports more messaging broker options than any other in .NET as well as having first class options for SignalR or messaging via HTTP or gRPC
an alternative HTTP or gRPC endpoint programming model that’s particularly useful because of Wolverine’s transactional outbox and messaging
if you absolutely have to, you can use Wolverine as “just” a Mediator tool
Thank you to all of the other Critter Stack core team members, Oskar & Corey for being there in the beginning, and the very vibrant Wolverine community for making so many contributions and giving the feedback it takes to make a tool like Wolverine.
All in all, it’s particularly gratifying to me because Wolverine has been such a slow burn project for almost a decade (more so if I count it as the successor project to FubuMVC / FubuTransportation) that I had completely given up on during the pandemic before growing into a tool that collects over a million downloads a month this year.
As an experienced software developer and the owner of a software tooling company I’d really like to continue to grow, I’m fully embracing the central role that AI assisted development now takes. I can’t say that I completely like how things have changed and we’re still clearly adapting as we go.
Just to complain a bit and try to make sense of our new world order, here’s where I think the bottle necks in software development have moved to, at least for me:
CI via GitHub Actions. We the entire OSS community are hammering GitHub in a probably unsustainable way and CI runs are now the ultimate bottle neck for Critter Stack development. This of course is after we got very aggressive with AI tools to expand the testing that runs in CI to the point where Wolverine currently has 46 CI gates and Marten has 32 (some of that is from matrix testing on different JSON serializers, .NET versions, and PostgreSQL versions). That explosion in usage plus GitHub implementing some rate limiting on the number of available action runners is definitely an impediment. More and more, I’m leaning back into using local testing runs to gate commits where I think that is suitably low risk. I think it’s also worth thinking hard about making CI runs be more selective about what CI gates are necessary for different pull requests or commits as another way of reducing usage.
I don’t know how I feel about this yet, but we’re occasionally opting for much bigger pull requests like this one that spans 8-9 issues. I know there’s a bit of a backlash against pull requests right now for plenty of reasons I’m quite sympathetic to, but pull requests provide tracking and visibility into progress and release notes for us. I’d like to keep using pull requests for that reason only for right now, but it’s something we need to evaluate changing.
Test execution time. Most of the Critter Stack tools almost have to be tested through their integration with infrastructure like databases and message brokers. To make that much worse, we have to frequently stand up and trash .NET applications with different configurations to test more use cases. The advent of AI has also made it much easier to build in far, far more test coverage to explore more permutations, “soak” tests, and other exploratory testing. Yea for more test coverage! Boo for the increased time to run test suites. Also, and this is a good problem to have, AI is making it much easier for our users to add actionable issues for normally hard to observe problems in the tools they find from their own exploratory testing (which is also easier to do now and you should!) — and those issues tend to require specialized testing harnesses to recreate their exact problem and tend to be expensive tests to run.
My own energy level. The increased mental overload from context switching, code reviews, and generally trying to make decisions fast enough and well enough to keep the agents spinning makes me burn out faster during the day. I take more breaks now than I did before.
Development box resources. I got unexpectedly lucky by needing to replace my main development box earlier this year right before memory prices spiked. In all seriousness, memory and CPU utilization for locally running Docker containers and our heavyweight test suites “limits” how many parallel agents I run — but that number is admittedly more than I can generally handle mentally anyway.
Nuget.org indexing time. I doubt this impacts many people nearly as much as it does me, but we’re frequently having to do cross repository work in the Critter Stack lately, and the latency of Nuget.org indexing newly published packages is noticeable, if better than I think it was this time last year.
Sorry, I don’t have a ton of answers to any of these problems or expect them to be the exact same issues you might be experiencing yourself. But hey, it’s at least good to start seeing where the bottlenecks are and concentrate our efforts to solving those problems first I guess.
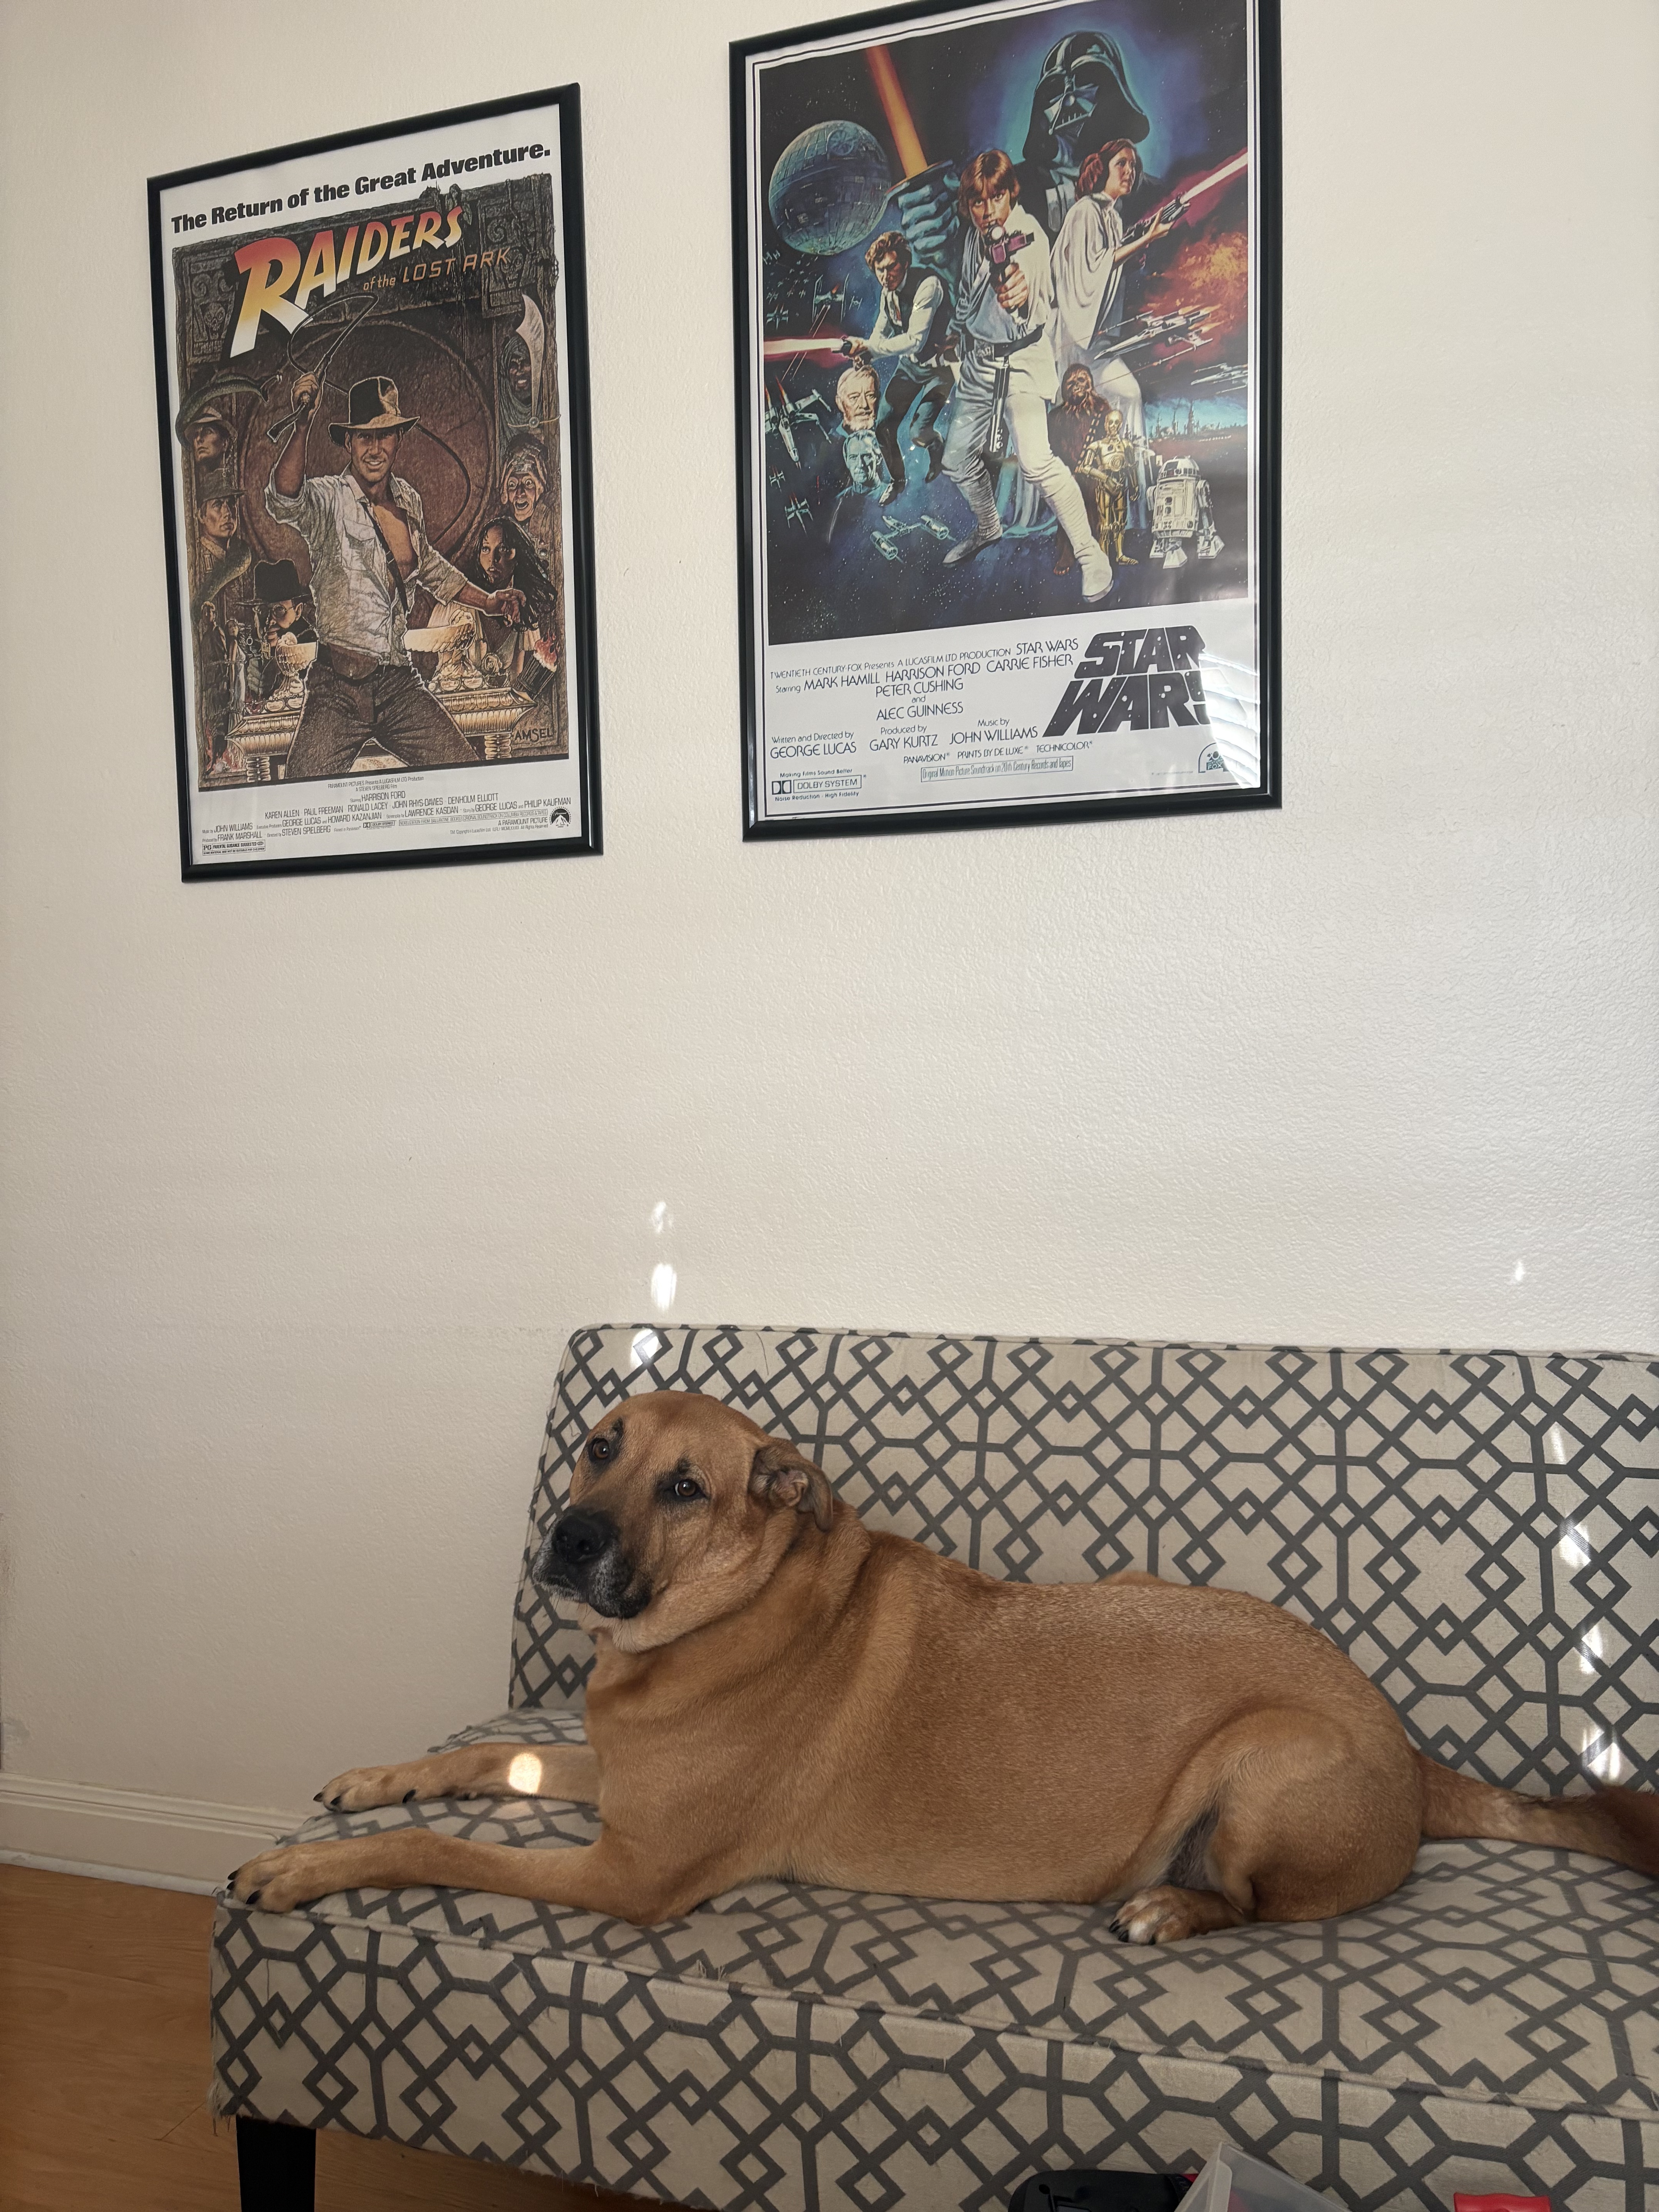
And apropos of nothing, my colleague is lounging on the job again today and I’m pretty sure that anyone walking into my office is going to know right off the bat that this is the lair of a Gen X guy who finally has the posters he wish he’d had as a kid.
I worked with my Dad’s construction crew in High School and college. On one job a lumber salesman would always come by right when we were taking a water break in the late morning and start by teasing us that we were always lounging around! I’m embarrassed to realize years later that he obviously did that on purpose to catch Dad at a good time to talk about what we were going to need next. Duh.
I think this week might have been one of the busiest weeks ever for GitHub traffic to Wolverine and I’m close to “I cannot work anymore, I just want to play pinball” levels of burned out on a Friday this week after dealing with all of that. And yes, having AI tools now makes that a lot easier mechanically, but it also makes it a lot easier for other folks to build pull requests or to analyze their own usage which has brought out plenty of issues that would probably otherwise go undetected. All told, the amount of context switching just trying to keep up with reviewing pull requests (because the buck stops here) and driving other fixes is a lot of (AI Brain Fry) work, just different than before.
Honestly, just to make me feel better, I had Claude do some research today to prove out that Wolverine actually gets much more community contribution than its .NET competitors — which I think is partially attributable to JasperFx’s “Open Core” model and partially because Wolverine is actually a much larger, more ambitious tool set in many ways than MassTransit or NServiceBus is (HTTP endpoints, more multi-tenancy options, quite a bit more modular monolith support, supporting an absurd number of messaging brokers, and far more options for simplifying application code being prime examples).
I’m focusing on pull requests here, and specifically on pull requests from people who are not part of the core team or on the payroll of the company behind the tool. Issues, Discord questions, and reproductions matter a great deal too (more on that later), but a merged pull request is the least ambiguous signal I know of that somebody outside the project cared enough to roll up their sleeves.
The numbers
Merged pull requests from outside contributors, October 2024 through October 2026:
Project
Community PRs merged
Distinct community contributors
Came back for a 2nd PR
PRs over 500 lines
Wolverine
397
154
64
52
Brighter
230
29
18
88
MassTransit
55
43
7
3
NServiceBus
15
5
1
0
MediatR
10
6
2
0
And the trend, year over year:
Project
Oct 2024 to Oct 2025
Oct 2025 to Oct 2026
Wolverine
116 PRs / 63 people
281 PRs / 110 people
Brighter
83 PRs / 11 people
147 PRs / 22 people
MassTransit
50 PRs / 39 people
5 PRs / 4 people
NServiceBus
4 PRs / 3 people
11 PRs / 3 people
MediatR
8 PRs / 5 people
2 PRs / 2 people
A few things jump out at me:
154 different people outside the core team got code or docs merged into Wolverine in two years. That’s more than three times the next closest tool in this list, and it nearly doubled from the first year to the second
64 of those folks came back and did it again. To me that’s the number that says the most about whether contributing to a project is a pleasant experience
The median community pull request to Wolverine was merged about 21 hours after it was opened, and roughly four out of five community pull requests that get opened end up merged
Brighter deserves a real tip of the hat here. It has a smaller contributor base than Wolverine, but a very committed one, and its community pull requests tend to be big
The MassTransit and MediatR numbers fall off a cliff in the second year, which lines up with both tools moving to commercial licensing in 2025. I’m not taking a shot at anybody for that, building a sustainable business around OSS is hard and I’ve had to make my own choices there. But it does change what “community contribution” looks like for those tools going forward
For my part, I’m genuinely impressed with Brighter and I didn’t realize that it was nearly that active, so hat’s off to Ian and their community.
Obviously, MassTransit and NServiceBus are mostly maintained by actual employees, but so is Wolverine (mostly me, but also Babu). And MediatR is small and mature, so you wouldn’t expect too much traffic there.
Where the community has made Wolverine better
Raw counts are one thing. What I actually care about is that big, important chunks of Wolverine exist because somebody outside of JasperFx Software built them or pushed for them. Here are some of the recent themes.
Deduplication with a response, just this week
Wolverine 6.45 added [DeduplicatedWithResponse], which gives you Stripe-style idempotency keys on HTTP endpoints where a repeated request gets the first response back instead of a bare “duplicate” refusal. That was Laurence Gillian‘s idea, Laurence’s issue, and then Laurence’s pull request, which weighed in at just under 4,000 lines with tests and documentation. Laurence followed that up with two more fixes for cases where a deduplication claim outlived a request that did no work.
In the same week, alesdvorakcz fixed the mark-as-handled path so it matches the whole inbox identity inside the caller’s transaction and releases ownership of handled rows, and Marko Lahma found and fixed an inline retry that was holding onto the failed attempt’s outgoing messages. That’s three different people hardening the same corner of the idempotency story in about four days.
Native AOT
I’ll be honest that I didn’t expect AOT to matter much for a tool that was built around runtime code generation. The community has been steadily telling me otherwise. This one hasn’t been pull request driven so much as driven by people actually trying it and writing up exactly where it fell over:
RaySinner reported a set of Native AOT startup crashes on Linux across both JasperFx and Wolverine
Derek Choate followed that up with the proposal to emit [DynamicDependency] rooting straight from the generated code
Christian Bergum Bergersen tracked down generic frame types that were still being closed reflectively under TypeLoadMode.Static, first in the event registration path and then in HTTP chain building. The first of those shipped in 6.45, and the second is in flight right now with an honest to goodness Native AOT smoke test for the HTTP path
Not every valuable contribution is a pull request. A precise issue from somebody running a real AOT build is worth more to me than most pull requests.
EF Core and multi-tenancy
I’d like the number of EF Core features we don’t support to be zero and continue to make Wolverine friendlier to EF Core users because that’s always going to be where most of the .NET community is. Some recent highlights:
Ali Yuksekkaya filed the three issues that touched off last month’s EF Core sweep, and this week landed a 1,500 line first pull request fixing step-method [Entity] loading, query plans, and multi-tenant DbContext resolution. Three of the seven bugs it fixed were silent data loss
PerfectlyNormal fixed a missing transaction commit for multi-tenanted EF Core
Geoffrey Marc made domain event scraping work on the managed multi-tenancy commit path and made tenanted message stores honor MessageStoreRole
Julien Mounier added optimistic concurrency for EF Core backed sagas, and Ferdavs Majitov and Artyom both improved how the outbox lines up with EF Core’s own transaction model
Whole transports and subsystems
This is the part that still surprises me when I look at the list. A lot of what’s on the Wolverine feature matrix arrived as a community pull request:
And lastly, the single most prolific outside contributor to Wolverine over the last two years is Dmytro Pryvedeniuk with 28 merged pull requests who did absolutely heroic work. It’s flaky test fixes, CI consolidation, build warnings, vulnerable dependency bumps, and resource disposal. That kind of work is exactly what makes it possible for everybody else’s pull request to get merged in under a day, and I’m very grateful for it.
Thank you
I’ve been doing OSS development for a long time now, and the thing I’m most proud of with the Critter Stack isn’t any particular feature. It’s that there’s a real community of people who use these tools hard, tell us when they break, and more and more often just send the fix. If you’re one of the 154, thank you. If you’ve been thinking about being number 155, the door’s open, and I’ll do my best to keep that 21 hour number honest.
How I counted
Source is the GitHub GraphQL API for JasperFx/wolverine, MassTransit/MassTransit, Particular/NServiceBus, LuckyPennySoftware/MediatR, and BrighterCommand/Brighter, counting pull requests merged between October 2, 2024 and October 2, 2026
Bot authors (Dependabot, Renovate, and friends) are excluded everywhere
“Community” means the author is not on the project’s core team or employed by the company behind it. For Wolverine I excluded myself, Babu Annamalai, Jaedyn, Anne Erdtsieck, and other JasperFx organization members. For MassTransit that’s Chris Patterson, for MediatR it’s Jimmy Bogard, for Brighter it’s the BrighterCommand organization members, and for NServiceBus it’s everybody I could identify as Particular Software staff from their public profile, organization membership, or commit email
GitHub’s own “member vs contributor” flag was not reliable for this because private organization membership shows up as a plain contributor, so the staff lists were built by hand. If I’ve put somebody in the wrong bucket, tell me and I’ll fix it
Several years ago when I was interviewing at Calavista, my future colleagues asked me what I was most proud of in my career. At the time I was mostly known for my writing years earlier at CodeBetter and StructureMap, but even then my obvious answer was Marten. Wolverine was even then my true passion project, but Marten is undeniably the biggest technical success I’ve ever had and the single biggest source of JasperFx Software business today.
Sometime this past weekend, Marten quietly rolled past 20 million downloads on NuGet. Almost exactly eleven years after the first commit in October of 2015, the “PostgreSQL as a document database” experiment that started as a tactical way to get off of RavenDB in a hurry has become the most widely used and, I’ll very happily argue, the most capable Event Sourcing solution in the .NET ecosystem.
Don’t write off Marten because it’s a FOSS tool in the .NET ecosystem — the perennial Harvey Dangerfield of technical platforms. Marten, especially when paired up with Wolverine, has a feature set that I believe is very competitive and in many cases superior to the commercial event sourcing tools in the JVM.
I wrote about Marten’s 10th birthday last year and a five year retrospective on adoption this spring, so I’ll keep this short. Twenty million is a nice round number though, and it’s worth a moment to say thank you and take stock.
The numbers
Straight from GitHub and NuGet this morning:
NuGet downloads
20,077,707
GitHub stars
3,460
Contributors
257
Pull requests merged
2,275
Issues closed
2,594 of 2,605 ever opened
Tagged releases
321
Latest release
V9.41.0, shipped today
Two of those matter more to me than the download count. 257 contributors is a real community (that’s a random Wednesday for a popular npm project, but huge for .NET), not a one-person project with a mailing list. And eleven open issues on a project this old and this large is the result of a lot of people caring about a lot of details for a very long time. Thank you to everyone who has filed an issue, sent a pull request, answered a question in Discord, or written up their experience for others.
For context on “most widely used”: the next closest event store package on NuGet, the official client for what used to be called EventStoreDB, sits at a bit over 8 million downloads. SqlStreamStore, EventFlow, and Eventuous are each in the low single-digit millions or below. Marten isn’t just in front. It’s in front by a wide margin, and the gap is widening.
Marten as a document database
Plenty of those downloads aren’t for Event Sourcing at all. Marten’s original pitch was simple: PostgreSQL is a fantastic database, JSONB is a fantastic storage format, and .NET developers deserve a document database experience without giving up transactions, a real query engine, or the operational know-how they already have. That pitch still holds.
You’ll see plenty of people online try to say that you can’t really use a relational database as the foundation for an event store, but our PostgreSQL foundation means that Marten can support a much stronger set of projection capabilities and genuine options for strong consistency that the “dedicated event store databases” cannot.
Marten is the most complete Event Sourcing toolkit on .NET, and it isn’t particularly close. Most event store products give you an append-only log and a subscription API, then wish you luck with everything else. Marten’s position has always been that the event store is only useful if the projections, read models, consistency model, and operational story are all in the box. Highlights that I think are unique, or at least unusually strong, in the .NET world:
Events and read models live in one database. You get transactional consistency between writes and inline projections, query read models with the same LINQ provider, and rebuilding a projection is one command instead of a migration project.
Dynamic Consistency Boundary. Marten 9 shipped first class DCB support for enforcing invariants across multiple entities without one giant aggregate stream. As far as I know it’s still the only mainstream .NET event store where this is built in. See Higher Performance DCB Development with Marten 9.0.
Wolverine. The Wolverine integration turns Marten into a full CQRS platform: the aggregate handler workflow (our version of the “Decider” pattern), a transactional outbox on the same database, event subscriptions feeding handlers, and HTTP endpoints that stream JSON straight out of PostgreSQL. That combination is what people mean by “the Critter Stack.”
Marten’s model has also become the template for the rest of the stack. Polecat brings the same projections and aggregates to SQL Server 2025, and Fisher does the same for embedded scenarios. Learn Marten and you’ve learned all three.
Where JasperFx fits
Marten is and will stay MIT licensed open source. What’s changed is that there’s now a real company behind it. JasperFx Software exists to make the Critter Stack sustainable for the long haul, and I explained the model in The “Open Core” Model for Sustainable OSS Development in .NET. If your team depends on Marten in production:
CritterWatch is our monitoring and operations console for Marten, Polecat, and Wolverine, with visibility into projections, subscriptions, dead letters, and message flow across a whole fleet, plus an MCP server for AI assisted production support. Plans are on the products page.
Critter Stack AI Skills teach Claude Code and other coding agents to write idiomatic Marten, Wolverine, and Polecat code the way we would. The latest additions are in AI Skills 1.10.
Thank you
Twenty million downloads, 257 contributors, eleven years. Marten got here because a lot of people decided PostgreSQL plus .NET was a good idea and kept showing up to make it better. If you’ve never tried it, the quick start will have you appending events and building a projection in about ten minutes. If you have, thank you. Here’s to the next 20 million.
Critter Stack Roundup: Two Weeks, Six Repositories, and an EF Core Sweep
It’s been a busy couple of weeks across the Critter Stack. Between September 13th and today, we merged roughly 370 pull requests across JasperFx, Weasel, Marten, Polecat, Fisher, and Wolverine, and shipped a pile of releases along the way. More importantly, a big chunk of that work came from, or was driven by, people outside of JasperFx Software, so there’s a lot of thanking to do in this post.
5.27.0, 5.28.0, 5.28.1, 5.29.0, 5.30.0, 5.31.0, and now 5.32.0
Weasel
9.33.0, 9.34.0, 9.35.0, 9.35.1, 9.35.2
JasperFx
2.69.1 through 2.75.2
Fisher
1.5.0 through 1.13.0
And Polecat 5.32 will be released by the time you read this.
And the big themes:
An Entity Framework Core sweep through Wolverine and Weasel, touched off by a set of sharp bug reports — I wouldn’t expect any of the bugs we address to impact many people, but I’d like the number of EF Core features not supported or features we don’t support well to be essentially zero
Vector, full text, and hybrid search across Marten, Polecat, and Fisher, all behind one shared API – this is to support our forthcoming agentic memory tool “Stoat”
Conjoined multi-tenancy tightened up and held to a shared compliance suite on every store. This was mostly a testing effort, but there were some EF Core related issues that helped spawn that work. It did find some issues with Polecat and Fisher when we did more compliance testing against Marten behavior to the younger tools
Error messages that tell you what to do instead of just telling you something went wrong – I wrote about that previously in our new AI Skills 1.14 release notes
Idempotency and agent distribution improvements in Wolverine, a lot of it from the community – Some things are just flat out hard. Gulp.
The EF Core Sweep
This one started with a trio of excellent issue reports from Ali Yuksekkaya against Wolverine’s EF Core integration:
Conjoined EF Core tenancy was ignored in the Lightweight transaction mode, so a message could be written under the wrong tenant and HTTP cascades skipped the outbox (GH-4611)
Conjoined tenancy allowed detached updates and deletes to touch rows that belonged to another tenant (GH-4612)
Returning Update<T> or Store<T> from a handler saved nothing at all for an entity the DbContext wasn’t already tracking (GH-4613)
Those got fixed, but reports like that are a signal that nobody had been looking hard enough at that corner of the code, so we went looking. The resulting sweep landed as a wave of Wolverine pull requests this weekend:
Lightweight EF Core message handlers now get a real transactional outbox. Before, Lightweight mode quietly meant no outbox enlistment, no domain event scraping, and no idempotency check
Domain event envelopes scraped out of the DbContext are now flushed before the Eager transaction commits. This was a leftover from an earlier fix where the scraped envelopes were tracked after the only SaveChanges() call and never persisted
Wolverine’s conjoined tenant query filter now composes with your query filter instead of replacing it. EF Core 9 and EF Core 10 behave differently here (EF 9 discards the earlier filter, EF 10 throws), and we now cover both
A new EfCoreOps family of declarative side effects for ExecuteUpdate, ExecuteDelete, raw SQL, and bulk inserts. These force the Eager transaction mode they need and scope themselves to the current tenant
A conjoined tenancy test battery that now runs against Marten, Polecat, and Fisher backed message stores
Closing several test coverage holes, including owned, complex, and JSON mapped models end to end
::: warning One of these changes is technically breaking. If you’re using AutoApplyTransactions() and a single handler could be claimed by two persistence providers (say, it takes both a DbContext and a Marten IDocumentSession), Wolverine used to silently apply no transaction at all. It now fails loudly at startup and tells you how to resolve it (GH-4631). If your application hits this, it had a real bug that this change is surfacing. :::
The sweep reached down into Weasel as well, which is where our EF Core schema migration support lives. Ali also reported that EF Core batched queries silently returned incomplete entities for owned, complex, and JSON members, and then contributed a follow up pull request to prepare each batched query once while keeping the provider’s parameter types intact. On top of that, Weasel now:
Materializes EF Core batched queries through EF Core itself
Carries database indexes that EF Core can’t model as their own DDL
Maps the columns of table-split complex properties, which were previously omitted and then dropped by CreateOrUpdate
Never drops a column from an EF Core derived table just because the model doesn’t happen to declare it
Marten, Polecat, and Fisher also all fixed the same bug where an EF Core backed projection leaked the DbContext it created per batch. Thanks to wpei-infotrack for reporting the Marten version of that one, which turned out to be a leaked PostgreSQL connection per batch in the async daemon.
Vector, Full Text, and Hybrid Search Everywhere
The other big feature push was around search. JasperFx now has a shared, store-neutral vector and hybrid search surface in JasperFx.Events.Vectors, and all three of our document stores implement it:
Marten.PgVector moved onto the shared contracts with scored search, HNSW index declarations, and hybrid search using reciprocal rank fusion over PostgreSQL’s ts_rank and the vector leg. Marten also now warns you when a full text search falls back to an unindexed, whole document scan
Polecat picked up vector search on SQL Server 2025’s native VECTOR type, a Polecat-owned full text inverted index with LINQ operators and BM25 scoring, prefix search, and hybrid search on top of both
Fisher got hybrid search and embeddings produced from an event stream
Because they all implement the same contract, there’s now a DocumentSearchCompliance suite in JasperFx that holds all three stores to the same behavior. As usual, the first real run of that suite found defects in the suite itself as well as in the stores, which is exactly what it’s for.
Polecat 5.32
Polecat 5.32 is the release that rolls up the last few days of work, and it’s largely about parity with Marten and about multi-tenancy:
Conjoined document tenancy sweep. Every document shape is now tested in both directions, and conjoined tenancy now also holds on the event, vector, and partition onboarding paths
Raw SQL in IBatchedQuery, bringing batching up to parity with Marten
Strongly typed identifiers are now assigned onto a live aggregated aggregate, just like Marten does
Document indexes, computed columns, and foreign keys are now modeled as Weasel schema objects, which means db-dump finally reproduces the full configured schema
Every tenant database is described in the store’s usage descriptor for a multi-tenanted store, which matters for CritterWatch
Event store diagnostic reads answer “no results” rather than throwing when the schema was never applied or has drifted
Adoption of JasperFx 2.75 and Weasel 9.35
Earlier in the window, Polecat 5.31 also made startup migrations take a real cross-process lock through sp_getapplock and routed the last few hand-escaped SQL construction sites through a shared escaping helper.
Multi-Tenancy, Everywhere
Multi-tenancy was a recurring thread through all six repositories:
JasperFx now has conjoined document tenancy compliance tests, and Marten, Polecat, and Fisher all enrolled
TenantIdStyle is now applied consistently. Marten applies it at every boundary that stamped or keyed on the raw tenant id, and Wolverine now normalizes Envelope.TenantId through it so that the stores reading that value write the right tenant
There’s a new canonical DisabledTenantException in JasperFx. All the stores and Wolverine now refuse a disabled tenant with that exception instead of reporting “Unknown tenant id”
IEventStore.OpenReadOnlyEventStore(tenantId) is now tenant aware, so the read-only tier is actually reachable in multi-tenanted systems
Marten and Fisher both fixed bugs with the diagnostic and explorer reads that CritterWatch depends on, including one in Marten where a read against an unknown tenant under sharded tenancy could provision a new tenant and run DDL
Error Messages That Name the Remedy
I spent a chunk of the last two weeks going through the exception messages across the stack, asking one question of each: does this tell the user what to do next? A lot of them didn’t. That turned into a wave of small pull requests:
Wolverine saga failures, handler discovery, missing aggregates, oversized Azure Service Bus messages, mismatched RabbitMQ queue declarations, missing Redis streams, missing HTTP transport clients, and SNS configuration problems all name the remedy now. Named connection strings are validated in one pass at startup. The SignalR transport fails the host start if the hub refuses the connection. Wolverine.HTTP gets a one-line opt in for mapping concurrency failures to a 409 ProblemDetails, and an unknown tenant id maps to a 404 instead of a 500
Marten stream identity mismatches, stream collisions, LINQ refusals, and the rich append concurrency exception all got clearer
Weasel decodes sp_getapplock failures, translates database permission failures into a typed exception, and now warns before AutoCreate.All drops and recreates an object
JasperFx lifted canonical ArchivedStreamException, DisabledTenantException, and stream exceptions so that all three stores throw the same types with the same guidance
On a related note, Marten 9.39 includes two SQL injection fixes, for GroupBy()HAVING comparison operands and for full text search regConfig values on every sink, not just the WHERE clause. If you’re on an older 9.x version, please upgrade.
Wolverine
Besides the EF Core work above, here are some of the highlights in Wolverine:
Capacity aware agent assignment.Michael Harris contributed per-node capacity ceilings for agent distribution (GH-3959), so one node dying no longer pushes its entire share onto the survivors. Anne Erdtsieck filed the original issue, and also contributed a fix for group affinity placement during blue/green deployments. There’s new documentation for the whole thing
Transactional deduplication. Wolverine’s deduplication claim can now ride the native Marten, Polecat, or Fisher transaction. Laurence Gillian reported that an HTTP deduplication claim survived a non-2xx response and turned legitimate retries into false duplicates, and that’s fixed too
An Oracle external table transport contributed by Travis Kirke, along with a fix for the Oracle durability agent’s incoming message recovery
GCP Pub/Sub now shares one subscription across nodes by default, thanks to a report from bittercoder about duplicated messages
Topology scoped message grouping rules, from a request by Anne Erdtsieck
Recurring schedule operability with occurrence attribution and a manual trigger, and a fix for non-UTC recurring schedules. Both came from issues filed by Babu Annamalai
OpenTelemetry parenting fixes. Recurring messages, inline receivers, and Wolverine’s internal agent loops no longer inherit whatever Activity happened to be current when they were started. Marten had a similar fix for spans being re-parented to their grandparent, reported by bohdan-hukivskyi. Open Telemetry sometimes has some weird behavior in terms of how parents are tracked. I expect or hope this will help the CritterWatch graphing of Otel spans from Wolverine
Tore Hammervoll fixed TypeLoadMode.Static so a handler chain finds its pre-generated type by full name instead of scanning exported types per chain
Two concurrency fixes reported by Marcin Aumiler: delayed sends to a partitioned PostgreSQL queue could be deleted without ever being handled, and the listener collection could be corrupted when agents started in parallel
Marten
Other than the search work, multi-tenancy, and messages, Marten had a lot of community driven fixes:
Anne Erdtsieck fixed the outer projection of GroupJoin/SelectMany and GROUP BY rendering over a join, made the projection batch fault properly when an operation can’t be configured, and made an unprovisioned event store answer “nothing” for its progression and dead letter tables
Erik Shafer fixed patched documents and replaced events to be stamped with the session’s actual instant (reported by BaerMitUmlaut)
vpetrevski routed QuickWithServerTimestamps stream starts through mt_quick_append_events to avoid sequence gaps
Arnel Robles corrected the pgvector docs and reported two async daemon bugs in the skip-ahead loader and progression writes
tychomensing-topicus reported a Select() projection problem with absent JSON keys
Weasel
Besides the EF Core work, Weasel got two nice community contributions. Joel Reinford made SQL Server migration scripts runnable under sqlcmd and safe to re-run, and Jaedyn moved us onto the patched advisory lock. Anne Erdtsieck also contributed a change to let the schema delta decide when an index needs a concurrent build.
JasperFx
JasperFx is just a foundational shared library, but a lot happened there:
The shared vector and hybrid search surface described above
A store-agnostic StubEventStream<T> for unit testing event sourced handlers, with documentation on all three stores
The @jasperfx/event-model-vue renderer moved into the JasperFx repository, next to the Event Model descriptor it draws, and the Event Model now handles services that host more than one model
Hardening the aggregate source generator, including an opt-in build-time assertion that the generator is actually attached
Andre Vieira fixed codegen test failing for every message handler since Wolverine 6.37, and Alan Klimowski fixed a code generation frame ordering issue (and a duplicated service declaration in Wolverine.HTTP)
Fisher
Fisher went from 1.5 to 1.13 in two weeks. Beyond the search work, Fisher now creates its event store tables on first use, supports directory tenancy on Windows, validates tenant ids before turning them into file names, fixes decimal comparisons in LINQ, and requires the source generator with a smoke test of the packed package. Kebin contributed a fix for enlisted sessions with an inline projection registered.
Thank You
The Critter Stack only gets this good because people use it hard (thanks?), tell us when it breaks with actionable error reports, and increasingly send in the fix too. Thank you to everybody who contributed code over the past two weeks:
Ali Yuksekkaya, Anne Erdtsieck, Michael Harris, Travis Kirke, Marko Lahma, Laurence Gillian, Tore Hammervoll, Alan Klimowski, Erik Shafer, Andre Vieira, Jakob Tikjøb Andersen, Joel Reinford, Jaedyn, Mark van der Dam, Raymond Masciarella, Arnel Robles, vpetrevski, Kebin, Marcin Aumiler, Jorge L. Torres M, and Rayan-and-beyond.
And to everyone who filed a good issue with a reproduction, including ArieGato, michielpeeters, raypet-visma, AndreiKopylov, framos-varajo, syserr500, BaharAtNode, Petteroe, zxjon22, r0ss88, bittercoder, BaerMitUmlaut, wpei-infotrack, bohdan-hukivskyi, tychomensing-topicus, and Babu Annamalai: those reports are what drove a lot of this.
No, seriously, the Critter Stack community is as far as we can tell far, far about average for OSS projects in terms of how helpful the community is to help drive and improve the tools.
I write these posts purposely on Fridays (when nobody will read it) just to reflect on where things are at and gather my own thoughts. I will admit that I think there is vastly more feature work in the rear view mirror than there is ahead, but there’s still some things still on the list. But you also never know when some major new software development trends will upend everything you think you think!
CritterWatch 1.1
I’m hoping that CritterWatch 1.1 will be ready for release by the first of October. At this point we’re “officially” feature complete and mostly trying to add more user interface polish and do a lot more manual testing.
The biggest single item is that we’re doing testing in a JasperFx’s client next week who wants to use CritterWatch on an immensely big and complex system (that also uses AWS SQS which is by far and away the whiniest messaging transport). I’m hopeful that getting access to their environment and being able to see CritterWatch admittedly struggle to monitor that massive system will do a great deal for us to get CW 1.1 ready to release.
If everything goes magically well next week, we might be sneaking in a new “Document Explorer” feature set to give you a very comprehensive database viewer for Marten, Polecat, and Fisher built into CritterWatch. That might of course float to 1.2. As it is, CritterWatch 1.1 made our Event Store Explorer feature much more feature rich and flexible to allow you to easily query and view event store data for Marten, Polecat, and Fisher.
You might notice that the project codename “Bobcat” deviates from our Mustelidae naming convention. “Bobcat” has been my working codename for a spiritual and modernized successor to my old Storyteller tool that I’ve been envisioning for longer than the “Critter Stack” naming scheme has existed. I’ve frequently said that my coding superpower is having a much longer attention span than average and Bobcat will maybe be the result of about 17-18 years of work and thinking in this space.
Bobcat is a new MIT-licensed “critter” for improved integration testing and will be the Critter Stack solution to “Spec Driven Development” and a key player in our forthcoming Event Modeling strategy I’ll discuss next.
The big theme is making automated integration testing more successful through:
A “Supervisor” library that uses the Microsoft Testing Platform to “supervise” integration heavy test suites and provide selective and adaptive test retries, flakiness detection, test parallelization, and even manage resources (Docker container resets or even starting an all new process) during tests. I realize that this effort is quite possibly something that’s just useful for Critter Stack development, but it’s already paid off for us!
Using some old ideas (that actually did work even if the project as a whole was a bust!) from Storyteller and FitNesse before that for making data intensive testing easier and provide useful, correlated telemetry for diagnosing test failures
An option for using Gherkin for expressing tests when the Given/When/Then format works or with people who are just comfortable with that approach
Being able to “project” specifications from existing xUnit or TUnit tests through (hopefully) judicious usage of attributes, comments, and source generators
Having your test harness be able to also expose a lot of application instrumentation and telemetry in the outputs for easier AI agent consumption and troubleshooting (again, really an old idea from Storyteller being rebuilt with AI agents in mind).
Some specific add on packages or recipes for HTTP testing with Alba and Spec Driven Development against Event Sourcing with the entire Critter Stack
I’ve thought and discussed a possible markdown authoring approach like ThoughtWork’s Gauge tool, but right now I’m personally leading toward just the combination of Gherkin or the C#/F# tests with projection.
As for the name, I was fascinated as a teen when bobcats started reappearing in our area again (there are actually some very real advantages for wildlife when far fewer people live on farms). But also, as someone with a rural background, people use the name “Bobcat” to refer to any skid steer tool and that carries the connotation of getting stuff done to me:
Event Modeling with the Critter Stack
I’ll share more details soon, but just know that Babu & I are working very hard on a new comprehensive Event Modeling support throughout the Critter Stack. This work and functionality is landing admittedly all over the place with the core JasperFx library defining our official “Event Model” API and that being supported by Wolverine and our event stores including Marten, Polecat, and Fisher. The Bobcat tool up above plays in this too by providing human readable specification rendering and execution. Mostly though, the AI agent coordination, scaffolding, and event model visualization will be from a new tool named “Stoat” that will be included with JasperFx’s AI Skills pack. And of course, our AI Skills tie everything together.
For right now, let me sum that up as:
Generate system code targeting the Critter Stack from a YAML file exported from the Event Modeling AI platform. Shame on me, but I’m not quite sure that’s a standard yet (this?) or just something from their own toolkit
Define an “Event Model” through a Gherkin specification or more likely through .NET code and see a visualization of the event model in a web browser as you work and refine that — and then, of course, generate system code from that model
Generate system code off of the “Event Model” as well as specifications using Bobcat (which could in turn just be riding on xUnit.Net or TUnit)
CritterWatch can visualize an Event Model for your system as it actually is based on the real application based on a combination of the system describing itself and using logging for cause and effect relationships between command messages or HTTP endpoints and the cascading messages or events appended
Our AI Skills and some hard coded scaffolding support in Bobcat make the generated code use the Wolverine and Marten/Polecat/Fisher idioms for low code ceremony and maximize testability
And of course, I’m a big believer in the “Semantic Model” strategy for frameworks, so every possible way you can define the “Event Model” like the import from the EventModelers.AI platform, our Gherkin DSL, a forthcoming C#/F# Fluent Interface we’re going to add to JasperFx.Events, or whatever other 3rd party DSL like ESDB we might support later will be translated first to our very own semantic model. All of our visualization and code generation will target our own semantic model.
That being said, I honestly think that it’s going to be faster in many cases to just write low fidelity C# or F# code in an IDE to generate the event model than it will be to use one of those intermediate modeling DSLs like ESDB or some of the other JSON, XML, or YAML dialects that are popping up. I also think that in the end many folks will probably drive the event model through chatting with an LLM, so we’re investing in our AI Skills to make that as seamless as possible too.
Just to level set, I’m struggling to be too enthusiastic about Event Modeling as a formal method used to specify in detail, then generate systems. I definitely think it can be helpful in a “Uml as Sketch” kind of analytic tool of course and I am a fan of doing interactive Event Storming sessions with domain experts. I’m old enough to remember when Model Driven Development was a complete bust and it’s hard for me to get past the obvious comparison. There are some real downsides to being older and more experienced. It’s natural to compare new ideas to older ideas you’ve already encountered, and sometimes that makes you miss the real differences or value in the new thing. Just something mildly depressing to think about for us older guys still doing software.
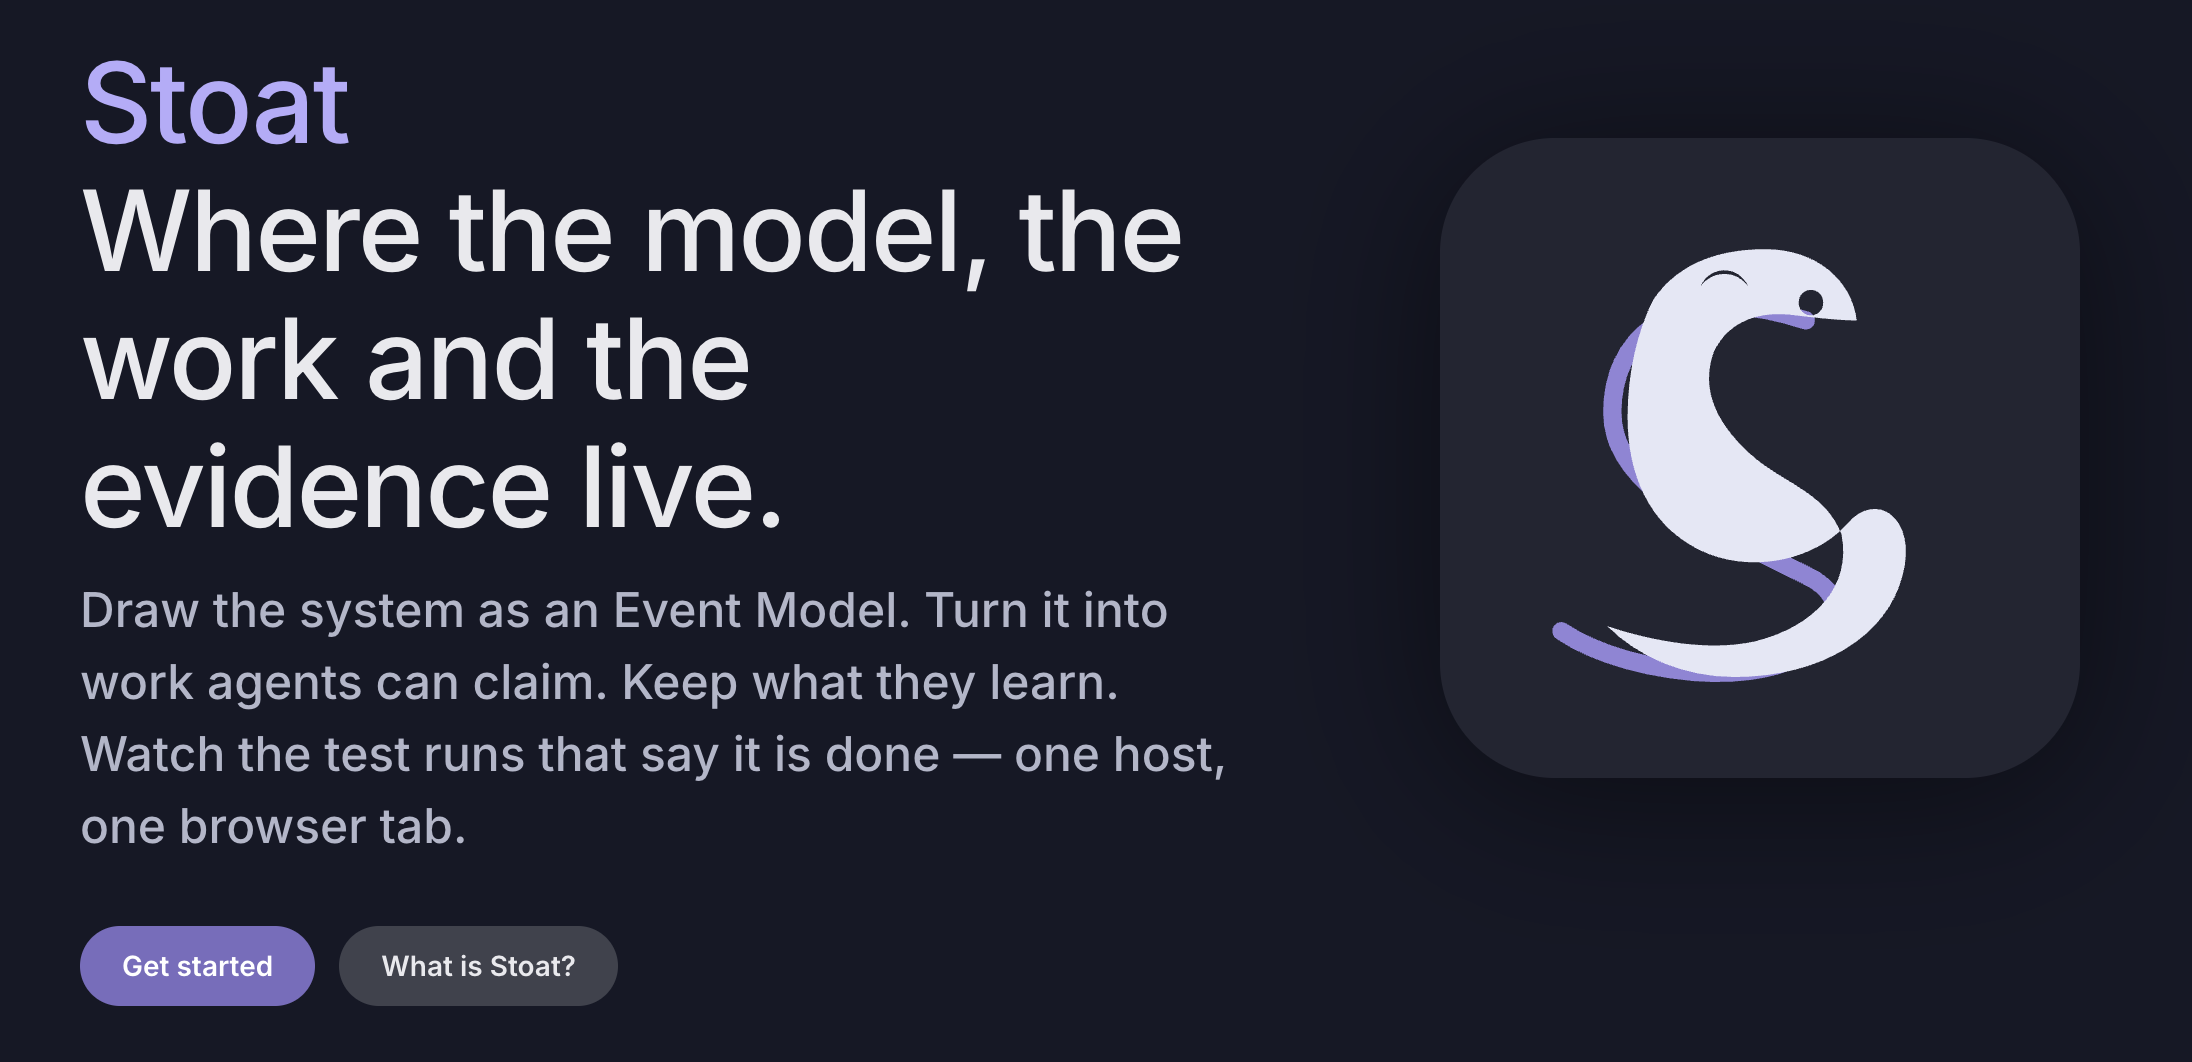
Stoat is the codename for a new tool from JasperFx Software that is targeted for AI assisted development, durable agentic memory, visualizing agent activity, coordinating agent activity across code repositories (it’s possible that I’m the only person who cares about that, but I care a lot), and as the glue behind our Event Modeling and Spec Driven Development strategy over all including a user interface for Bobcat specification previews and execution.
There’s a documentation site up, but just know that the website is 100% AI generated with lots of Opus inflected Yoda-speak and many things will change before we inflict Stoat upon the world. I’m hoping that Stoat will have its first release at the same time as CritterWatch 1.1.
We will also be doing a full review of the website to improve the verbiage too of course, but sometimes it’s just easiest now to let an AI tool draft something then mostly rewrite it.
Just know though, that Stoat will be a commercially licensed tool that will be bundled (retroactively too!) with the JasperFx AI Skills pack or CritterWatch.
Wolverine has long had support for message idempotency using Wolverine’s transactional inbox to track messages that have already been handled, but that usage only applies to Wolverine metadata and does nothing from an upstream sender (or let’s be honest, your code) accidentally sending the same logical message.
Recent versions of Wolverine added “logical message deduplication” as well to allow you to specify business logic concerns as the identity for another level of protection.
For example:
The operator clicked Rebuild twice. The console republished the command after a timeout. A scheduling agent pre-published tonight’s 03:00 occurrence yesterday, and the scheduler published it again on the night. Should the projection rebuild four times?
Each of those is a different delivery of the same intent, so each carries a different Envelope.Id and every one of them gets through. What is needed is an identity for the intent, and that is what DeduplicationId is.
We probably should have added this feature ages ago, but we did so in 6.31 to get ready for Wolverine to have a first class (but minimal!) chron message scheduler and use the deduplication id as a way of preventing multiple executions in a chaotic world.We know users are already taking advantage of this because JasperFx has already done some enhancements and optimizations for one of our clients.
You do need to explicitly enable this (because it potentially adds database tables or columns and we do not make mandatory database changes outside of major version releases. Backwards compatibility is a pain, but it’s you know, kind of important).:
Don’t worry, it’s Wolverine, so there are of course some magical policy ways to shorten the configuration.
A logical id is a string so it can be legible to users.
The second message with that id never reaches your handler. It is discarded, acknowledged to the broker, and logged at Information — a duplicate that vanished without a trace would be indistinguishable from a message that was lost.
Where the id comes from
By default a message handler reads Envelope.DeduplicationId. You can point at a member of the message itself instead, so publishers do not have to set DeliveryOptions:
publicstaticclassCreateOrderHandler
{
// Derive the logical id from a member of the message itself rather than
ValueSource.Header reads an envelope header, and ValueSource.Anything uses the chain type’s natural default.
Deriving the id on the publishing side 6.31
Everything above is the receiving half. On the publishing side, asking every call site to remember DeliveryOptions.DeduplicationId is exactly the kind of repetition that eventually gets forgotten at one call site and silently un-protects a message. So a message type can declare its own logical identity once, the same way it can already declare a topic name with [Topic] or a saga id with [SagaIdentity]:
// The message type declares its own logical identity once, and every publisher
Either form is applied as an IEnvelopeRule when the message is routed, so it reaches every transport, the local queues, and the outbox alike. Non-string members are converted with ToString().
Or if you need to, or just want to do so explicitly, you also have this syntax:
If you’ve never heard of it (there’s something like umpteen seasons of a basic cable reality show about it somewhere), just set a timer first to quit before you spend all day reading about it.One of the most kill joy things I have ever read is a somewhat reasonably sounding explanation for the “treasure pit” being a natural sinkhole though.
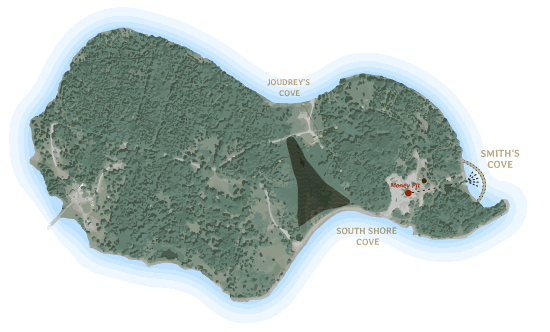
I was exactly the kind of kid who couldn’t read enough about Stonehenge or the search for the Titanic (which hadn’t been found yet when I was younger) or “Alien Astronauts.” In particular, I have always been fascinated by the Oak Island Mystery where there may (or probably not) be buried pirate treasure on an island off of Nova Scotia. To over simplify it, treasure hunters who have tried to dig up the treasure have continuously stumbled into more problems right after thinking they’ve passed one barrier. Hit a barrier of logs? Rip them up and keep digging, but it turns out there’s another one below it. Dig that one up? The tunnel floods. Send dye down the shaft to try to figure out where and how the water is getting in? There appears to be a tunnel dug to the hole from a cove. Plug that hole up? It appears there’s another tunnel to a different cove! And you get the point.
I have frequently described particularly hard troubleshooting efforts as “Oak Island Problems.” You know, the kind where you pat your back along the way anytime you’ve “moved the exception!” Except in our case, we can generally get to the bottom of it and get things fixed without spending hundreds of years and maybe a dozen lives in accidents trying to find the treasure that may or may not actually exist.