


There’s and important Wolverine 6.1.0 enhancement release this week that follows up on the big Critter Stack 2026 wave with even more improvements to our “cold start” performance. Specifically today, I’d actually like to talk about how we improved and extended the command line diagnostics tools in the Critter Stack to make it faster and more useful — especially in our new world order of AI assisted software development.
If you’ll pay attention to a coding agent at work, you’ll notice that it’s doing a lot of brute force work through successive command line calls on your system. It turns out that exposing diagnostic information about your system or database or really any system state through command line tools that generate easily parseable information to stdout turns out to be a great way to enable AI agents. You could even say (with a cringe) that:
Now though, the AI utilization of command line tools brings us to some new needs:
- It would be awfully nice to optimize the command line tools for faster cycles now that it’s a machine trying to utilize the output rather than a human who probably won’t hardly notice some minor delays due to command discovery and application bootstrapping
- The command line output in some cases now needs to be optimized for terse, easily parsed data that will be read by the AI agent
Alright, back to the Critter Stack. Buried all the way at the bottom of our stack is a command line parser that originated with FubuMVC about 15 years ago. The value of our particular CLI tooling is that it allows you to utilize custom commands discovered in assemblies within your system. We’ve depended on that pretty heavily over the years to introduce quite a few built in utilities for managing dependencies, environment checks, projection rebuilds, and database management.
This seems to be a good point to give a shoutout to Spectre Console that we use internally to make our output a lot prettier than it would be otherwise.
Here’s a little visualization of the various commands hanging out across the Critter Stack:
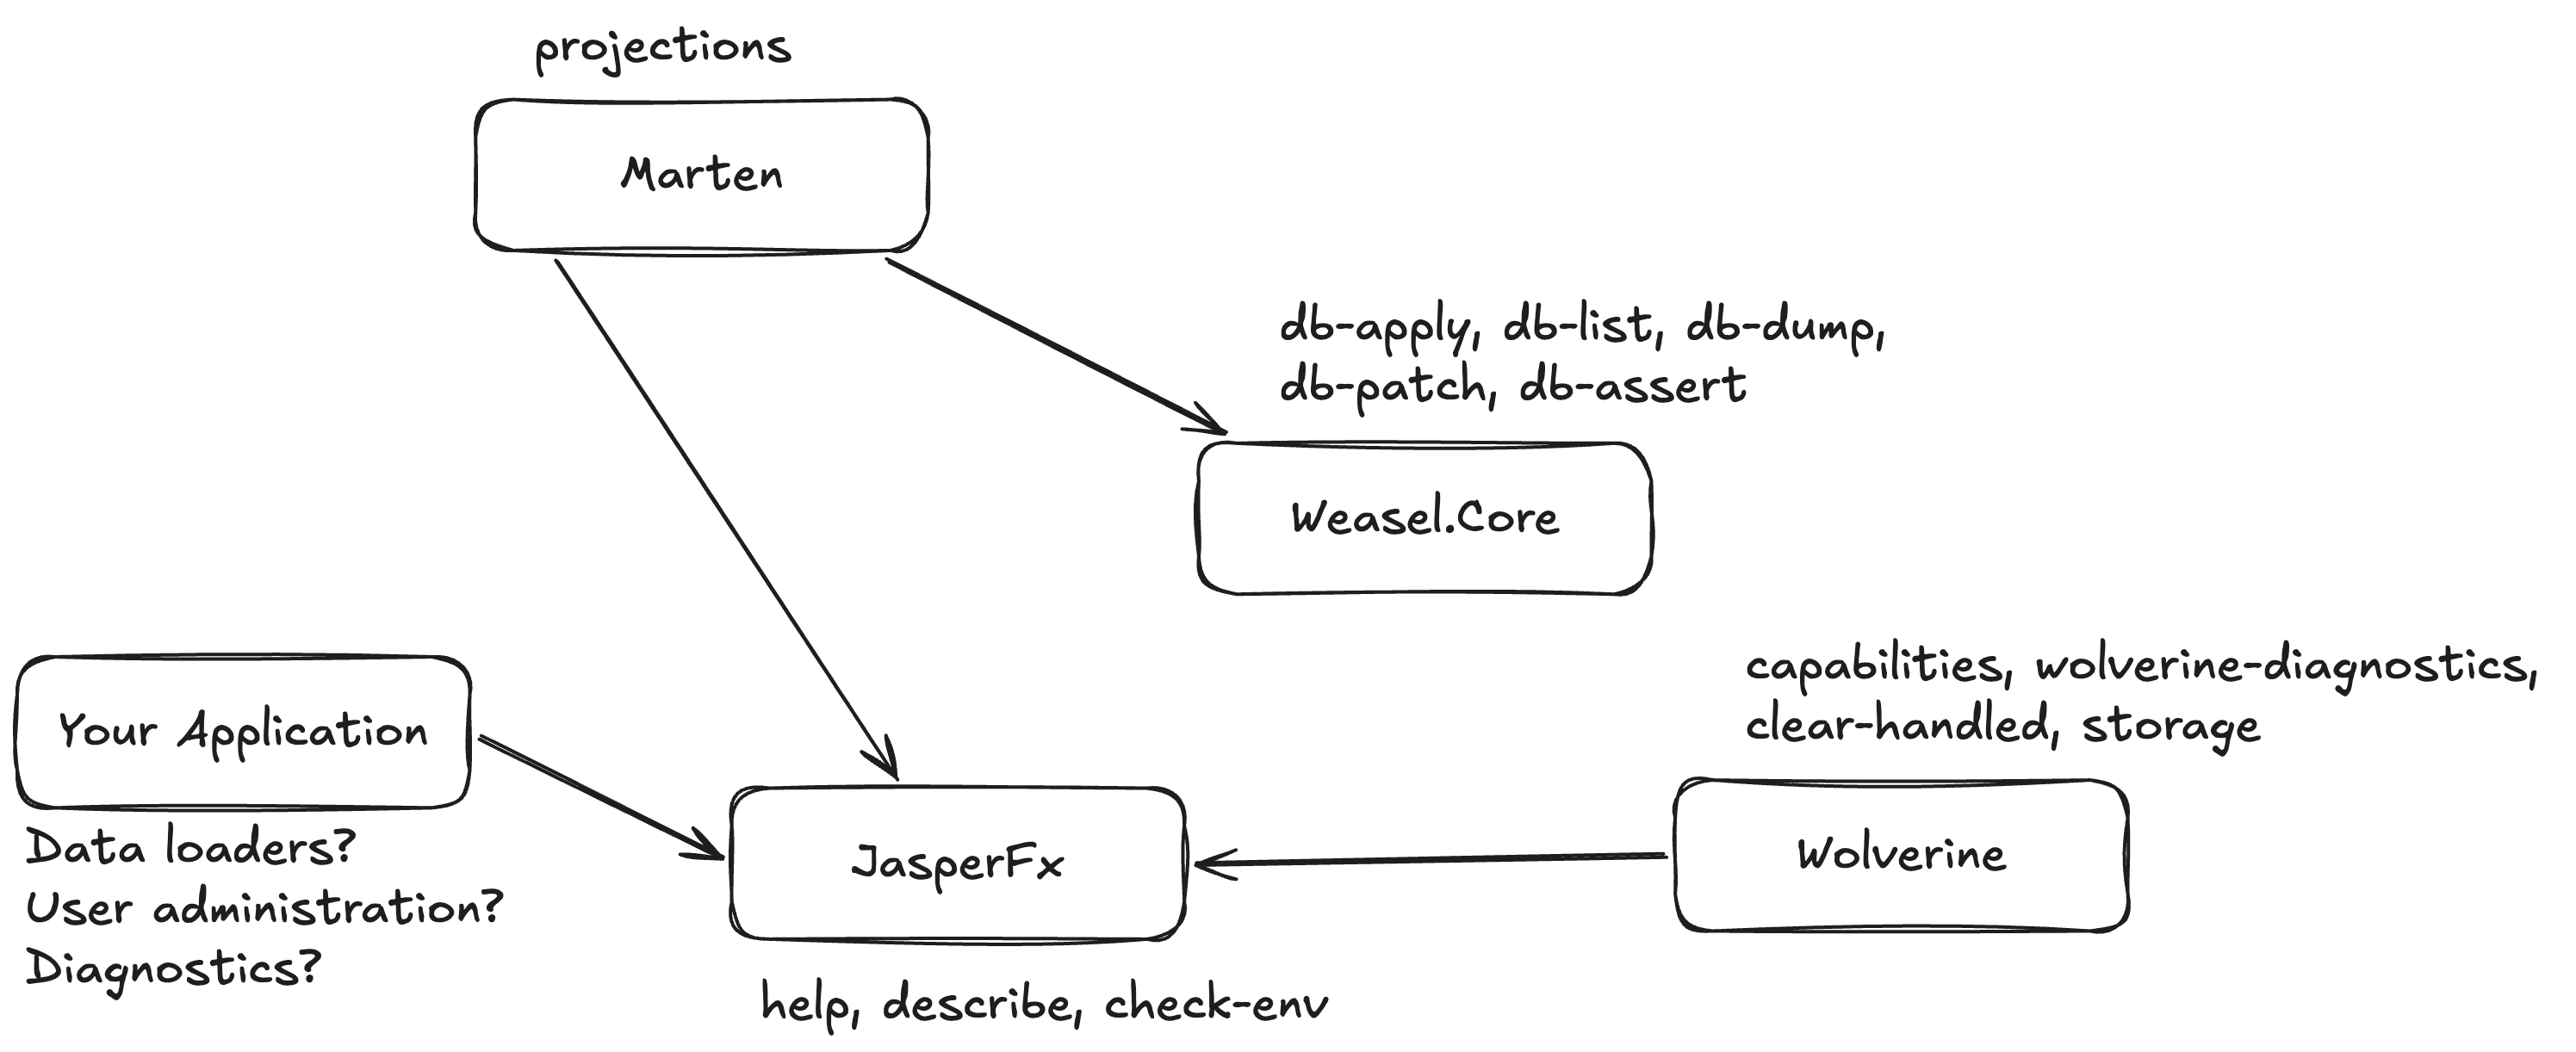
And of course, many folks will utilize our command line discovery to create their own CLI commands for any number of their own custom diagnostics, batch job runners, or data loading tasks that can be baked directly into their application.
All good so far? It’s been a very useful subsystem for us, but the auto-magic wiring of commands from all these assemblies in your system was enabled by assembly scanning to discover concrete command types upfront.
For the recent “Critter Stack 2026” wave of releases, we switched the command discovery to relying on a source generator (JasperFx.SourceGenerator) to build in the discovery and even more of the parsing code up front to reduce the time it takes a JasperFx CLI enabled application to spin up and be ready to work. This was done quite purposely to optimize the cycle time for AI agent usage, especially if you’re running from pre-compiled code. We also made some optimizations to the command parsing itself too.
Step 1: Get the Big Picture with describe
For the exhaustive flag-by-flag reference, see the Command Line Integration and Diagnostics guides.
First off, if you have either Marten, Polecat, or Wolverine active in your codebase, you can add this line at the very bottom of your Program file (or Program.Main() method, same difference) that opts into the JasperFx command line runner:
// Opt into JasperFx for command line parsing to unlock the built in// diagnostics and utility tools within your Wolverine application// And this *exact* signature is important so that the exit code is// correctly handled to denote failures!return await app.RunJasperFxCommands(args);
You can verify that the JasperFx is enabled by:
dotnet run help
And also, dotnet run help [command name] to see the specific arguments and flag usage of any specific command.
Wolverine and Marten are a configuration-heavy with plenty of options that impact behavior. Conventions, policies, middleware, transports, and explicit routing all layer together, which is powerful — but it can leave you asking “what is my app actually doing?” For that, we have this command that’s writes out a textual report
dotnet run describe
describe prints a series of tabular reports about the running configuration:
- Wolverine Options — the basics, including which assembly Wolverine thinks is your application assembly and which extensions loaded
- Listeners — every configured listening endpoint and local queue, with how each is configured
- Message Routing — where known, published message types are routed
- Sending Endpoints — configured endpoints that send messages externally
- Error Handling — a preview of the active message-failure policies
- HTTP Endpoints — all Wolverine HTTP endpoints (only when
WolverineFx.Httpis in use) - Marten or Polecat configuration
This is also the report that I will most often ask you to paste when you need help online.
Step 2: See the Code Wolverine Generates
Wolverine generates the adapter code around your handlers and HTTP endpoints at startup. When you want to see it — what middleware ran, how dependencies resolve, where transactions wrap — write it out or preview it:
# Write all generated code to /Internal/Generated
dotnet run -- codegen write

# Or just dump it to the terminal
dotnet run -- codegen preview
codegen covers the whole app, which can be noisy. When you want to understand a single entry point, reach for codegen-preview under the wolverine-diagnostics parent command :
# A message handler (fully-qualified, short, or handler class name — fuzzy matched)
dotnet run -- wolverine-diagnostics codegen-preview --handler CreateOrder

# An HTTP endpoint (requires Wolverine.Http; format "METHOD /path")
dotnet run -- wolverine-diagnostics codegen-preview --route "POST /api/orders"

# A proto-first gRPC service (requires Wolverine.Grpc)
dotnet run -- wolverine-diagnostics codegen-preview --grpc Greeter
The output is identical to codegen preview, but scoped to one handler, so the signal-to-noise ratio is far higher. This command was 100% meant for AI tool usage, but it’s hopefully helpful for human usage. We have been investing in JasperFx’s curated AI skills to “know” how to use these tools to troubleshoot Critter Stack application building inside of AI coding agent work.
Conveniently enough, you are now able to purchase access to our curated AI Skills online — but these are also bundled into JasperFx Software support plans.
We’re going to add an interactive mode to the new wolverine-diagnostics tool soon for easier human usage.
Step 3: Understand Where and Why Messages Route
describe shows you the routing table. When you need to focus on one message type — or understand why it routes the way it does — use describe-routing :
# One message type (full name, short name, or fuzzy match)
dotnet run -- wolverine-diagnostics describe-routing CreateOrder

# The complete routing topology
dotnet run -- wolverine-diagnostics describe-routing --all
For a single type you get the local handler, a routes table (destination, local vs. external, Buffered/Durable/Inline mode, outbox enrollment, serializer, and how each route was resolved), and any message-level attributes such as [DeliverWithin].
The most useful flag is --explain , which walks Wolverine’s route-source chain in order and shows what each source produced and which terminating source short-circuited the rest:
dotnet run -- wolverine-diagnostics describe-routing CreateOrder --explain

# Same explanation as structured JSON, for tooling or AI agents
dotnet run -- wolverine-diagnostics describe-routing CreateOrder --json
This is the command-line surface over the IWolverineRuntime.ExplainRoutingFor(Type) API. The text output is deliberately stable and labeled so it reads well for humans and parses cleanly for automated tooling. See Troubleshooting Message Routing for the programmatic side.
Step 4: Troubleshoot Handler Discovery
If you expected Wolverine to find a handler but it isn’t running, ask Wolverine to explain its discovery decision for that type:
# By handler class name (also accepts a fully-qualified name or a fuzzy partial match)
dotnet run -- wolverine-diagnostics describe-handlers CreateOrderHandler
The argument is matched against the types in your application, and if it matches more than one type you get a report for each. Every report tells you whether the type’s assembly is being scanned, which type-level include/exclude rules HIT or MISS, and — per method — whether it satisfies the handler naming and signature conventions. It’s the command-line surface over WolverineOptions.DescribeHandlerMatch(Type), so you don’t have to drop a temporary Console.WriteLine(...) into your bootstrapping code (see Troubleshooting Handler Discovery).
Step 5: Check Your Infrastructure
Wolverine’s transports and the durable inbox/outbox register self-diagnosing environment checks — can I reach the database? the broker? are the IoC registrations valid?
dotnet run -- check-env
To create, inspect, or tear down the stateful infrastructure Wolverine needs (queues, tables, topics):
dotnet run -- resources setup # also: check, list, teardown, statistics
resources setup is a great way to provision a clean environment before a test run.
Step 6: Inspect and Recover Message Storage
For applications using the durable inbox/outbox, the storage command administers the message store:
dotnet run -- storage counts     # incoming / outgoing / scheduled / dead-letter / handled
dotnet run -- storage clear
dotnet run -- storage rebuild                                   # --file to emit the schema script
dotnet run -- storage release --exception-type Some.Exception   # replay dead-lettered messages
storage counts is the quick “is anything backing up?” check, and release re-queues dead-lettered envelopes (optionally filtered to a single exception type). To purge inbox rows already marked Handled:
dotnet run -- clear-handled
Step 7: Export a Full Snapshot with capabilities
dotnet run -- capabilities wolverine.json
Writes a complete JSON description of the application — settings, message types, message store, messaging endpoints, even configured event stores. It’s useful for support, for feeding external tooling, and for detecting unintended configuration drift between deployments.
Bonus: Generate OpenAPI Offline (Wolverine.Http)
If you use WolverineFx.Http, you can generate the OpenAPI document without starting the host — no database or broker required, which makes it CI-friendly:
dotnet run -- openapi --list                  # list document names from AddOpenApi()
dotnet run -- openapi -d v1 -o swagger.json    # generate a document to a file
dotnet run -- openapi --route "GET /orders/{id}"
Cheat Sheet
| Command | What it answers |
|---|---|
describe | What’s my whole configuration? |
codegen write / preview | What code is Wolverine generating? |
wolverine-diagnostics codegen-preview | …for one handler / endpoint / gRPC service |
wolverine-diagnostics describe-routing [--explain] [--json] | Where — and why — does a message route? |
wolverine-diagnostics describe-handlers <TypeName> | Why is (or isn’t) a type discovered as a handler? |
check-env | Can I connect to my infrastructure? |
resources setup / check / teardown | Provision or inspect stateful resources |
storage counts / clear / rebuild / release | Inbox/outbox state and recovery |
clear-handled | Purge handled inbox rows |
capabilities <file>.json | Full machine-readable app snapshot |
openapi | Generate OpenAPI docs offline (Wolverine.Http) |
Where to Go Next
- Command Line Integration — the full reference, including every flag
- Diagnostics — handler-discovery troubleshooting and the routing-explanation API
- Code Generation — how Wolverine’s generated code works
Wait, how does this work with Aspire?
But wait, what if you’re using Aspire as a de facto replacement for docker compose locally such that your applications can’t really run without Aspire being started up first? How is that going to work?
Um, I need to have a better answer for that myself. Let me get back to you on that one!
So, what’s JasperFx Software’s game plan for AI?
We’re going to throw all the spaghetti up against the wall!
More seriously, we’re going to bet on the command line usage described here + AI Skills combination as our first step. We’re also building quite a bit of MCP support into the CritterWatch commercial tooling that will hopefully be generally available in the next couple weeks. The last bit of planned spaghetti is some spec driven development experimentation we’re doing off in the background that’s going down a Behavior Driven Development strategy rather than trying for any kind of user interface modelling approach.

