


Like probably all software tool companies, JasperFx is working very hard to create a compelling story about the utilization of AI-assisted development with our tools. The MCP support — and command line tools too! — in CritterWatch is a major part of our AI strategy.
So far JasperFx Software has mostly been showing off CritterWatch as a user interface tool that you’ll use to peruse and explore what’s happening in your system.
Today, let’s shift to how CritterWatch empowers your AI tools to understand and even administer your running suite of Critter Stack applications through its MCP tools. I should note a few more things before we jump into the sample usages:
- Everything exposed through the MCP tools in CritterWatch is also available through a command line package
- The MCP tools are gated by your CritterWatch license
- CritterWatch’s configurable RBAC support extends to the MCP functions
- We have invested, and will continue to invest, in making JasperFx’s curated AI Skills know exactly how to take advantage of both the MCP and CLI tools — as well as all the other command line diagnostics already built into the Critter Stack!
Before we get into the real details, just know that everything below is a real recorded session from earlier today: Claude, pointed at the CritterWatch MCP endpoint on my dev machine, driving our full Aspire-orchestrated sample fleet that we use to develop and test CritterWatch itself — 25 monitored services, PostgreSQL and SQL Server event stores, RabbitMQ, Azure Service Bus emulator, and AWS SQS via LocalStack, all chattering away. The trouble in this session was manufactured on purpose with CritterWatch’s built-in chaos monkey tools (which are themselves MCP tools — more on that later), because a demo that waits around for production to genuinely catch fire makes for a long blog post. But every tool call, every JSON response, and every “wait, that’s not what I expected” moment is the real thing, lightly trimmed for length — and the blockquoted Agent replies you’ll see are how Claude actually wrote the raw JSON back up for me, tables and recommendations included. That’s not me grading my own homework — it’s the same MCP surface you’d point your own agent at.
Two minutes of setup
The MCP server rides along in the CritterWatch console host. If you’re already running CritterWatch, you mount it with two lines:
csharp
builder.Services.AddCritterWatchMcp();// ...app.MapCritterWatchMcp(); // mounts at /api/mcp
That registers 48 tools — 21 read tools and 27 action tools — over MCP’s streamable HTTP transport, deliberately configured stateless so every tool invocation sees the actual caller’s identity for authorization (a subtle thing that matters a lot once RBAC is in play — see the end of this post). If your host is already composing an MCP server from the per-tool packages, there’s a chaining overload that folds CritterWatch’s tools onto the same endpoint alongside them.
Pointing an agent at it is a config stanza, not a project. For Claude Desktop or Claude Code:
jsonc
{ "mcpServers": { "critterwatch": { "url": "http://localhost:5173/api/mcp", "transport": "streamableHttp" } }}
There’s a quick start for the consumer side that covers MCP Inspector, Claude Desktop, and rolling your own client. That’s the whole setup story. Now the fun part.
“What’s going on in production?”
I would like to point out that CritterWatch’s AI abilities should also be valuable at development time, and we’re investing quite a bit in our AI-assisted development story and expect CritterWatch to be a big part of that.
The session opened the way every on-call shift opens — with the vaguest possible question.
Me: What does my fleet look like right now?
Agent →
summarize_cluster_health()
json
{ "services": { "total": 25, "names": ["HelpDesk", "Inflow", "ItemService", "MTTripService", "PolecatTripService", "TripService", "..."] }, "nodes": { "total": 29, "distinct": 4 }, "endpointHealthByStatus": { "Active": 697, "Accepting": 352 }, "brokerHealthByStatus": { "Healthy": 14 }}
And here’s the part that raw JSON dashboards never give you — the agent turned that into an answer, not a data dump:
Agent: Your fleet looks healthy right now:
Monitored services 25 Wolverine nodes 29 (4 distinct hosts) Endpoints 1,049 — all ActiveorAccepting, none stopped, no senders latchedBroker connections 14 / 14 healthy Nothing looks off at the fleet level. Want me to drill into a specific service, check for active alerts, or look at projection lag anywhere?
Twenty-five services, over a thousand endpoints, fourteen healthy broker connections — read, interpreted, and handed back with the next three sensible questions already offered. Nothing was wrong — yet. So I gave it something to find.
Dead letter triage, the whole loop
The dead letter queue is where I think the MCP story goes from “neat” to “oh, I’d actually use this.” CritterWatch has a first-class Dead Letters page, but the MCP surface closes the full loop for an agent: two read tools to discover and explain what died, and two action tools to do something about it — without a human ever pasting envelope ids around.
For this session I used our internal chaos monkey tool to write 40 realistic dead letters into TripService’s message store — varied message types, varied exception types, and a configurable fraction seeded as genuinely recoverable, so “replay what will succeed” is a real decision rather than a scripted gesture. Then:
Me: What’s failing on TripService and why?
Agent →
summarize_dead_letters("TripService")
json
{ "serviceName": "TripService", "totalDeadLetters": 40, "groups": [ { "database": "wolverinedb://postgresql/localhost/postgres/trips", "messageType": "ChaosSeededPayment", "exceptionType": "System.TimeoutException", "count": 6 }, { "messageType": "ChaosSeededNotification", "exceptionType": "System.TimeoutException", "count": 6 }, { "messageType": "ChaosSeededReconciliation", "exceptionType": "System.InvalidOperationException", "count": 4 }, "... grouped by message type × exception type, largest first ..." ], "databasesAnnounced": 1, "databasesAnswered": 1, "partial": false}
This is the triage view: counts grouped by message type and exception type, per message database. Here’s how the agent presented it back to me — and notice that it doesn’t just reformat, it diagnoses:
Agent: TripService is carrying 40 dead letters, all in the
tripsPostgreSQL store. Every announced database answered (1 of 1), so these counts are the complete picture, not a floor.
Message type Exceptions seen Count ChaosSeededPaymentTimeout, Arithmetic, InvalidOperation, Data, External 14 ChaosSeededNotificationTimeout, InvalidOperation, Data, Arithmetic 10 ChaosSeededReconciliationTimeout, InvalidOperation, Data, External 10 ChaosSeededShipmentData, Arithmetic, InvalidOperation, External 6 The shape here matters: many exception types spread across many message types reads like transient infrastructure trouble (timeouts, connection resets, contention) rather than a single poison message. Most of these should succeed on replay. Want me to pull the individual envelopes and try?
That “the shape here matters” reasoning isn’t something I prompted for — an agent (or a human) reads the pattern: lots of exception types across lots of message types smells like a dependency being down; one message type with one exception smells like a poison message. And do notice databasesAnnounced versus databasesAnswered — the reads fan out across every physical message database the service owns and tell you explicitly whether everyone reported. An empty result where only three of eight stores answered is not an empty queue, and the tool refuses to let an agent confuse the two. That distinction exists because of a real production failure mode where a console rendered “no dead letters found” over a queue quietly holding 42 of them.
From there the agent pulled individual envelopes — with ids, exception messages, and source URIs. Here’s one of them, verbatim:
json
{ "id": "01a059a6-d30a-4906-ad13-5232ba7f466c", "database": "wolverinedb://postgresql/localhost/postgres/trips", "messageType": "Wolverine.CritterWatch.ChaosMonkey.ChaosSeededPayment", "exceptionType": "System.TimeoutException", "exceptionMessage": "Malformed payload rejected by the validator", "source": "TripService", "sentAt": "2026-08-31T17:21:20.362632+00:00"}
And got to work:
Me: Replay whatever will succeed now, and get rid of the rest.
Agent →
query_dead_letters("TripService", limit: 200)→replay_dead_letters("TripService", [40 envelope ids])
The replay is fanned out to the service’s own message store and re-handled there — CritterWatch relays the command over the same Wolverine messaging backbone it uses for everything else. A minute later the agent re-summarized:
json
{ "totalDeadLetters": 15, "groups": [ { "messageType": "ChaosSeededReconciliation", "exceptionType": "System.InvalidOperationException", "count": 5 }, "..." ] }
And then reported back with exactly the partition you’d want from a colleague:
Agent: Replay complete. Here’s how it shook out:
- 25 of 40 drained — every
TimeoutException,DataException,ArithmeticException, andExternalExceptioncleared on retry, which confirms those were transient infrastructure failures.- 15 bounced straight back to the queue, and every survivor is a
System.InvalidOperationException— the handler rejects these messages deterministically. Replaying them again will produce the same result. These look like genuine poison: either the payload is malformed or the handler has a bug for this input shape.I’d recommend discarding the 15 (or holding them for a developer to inspect first). There is no undo on a discard — say the word.
Genuinely poisonous messages don’t get better because you asked nicely, so I said the word:
Agent →
discard_dead_letters("TripService", [15 envelope ids])Agent: Done — 15 discarded. Final check:
summarize_dead_lettersreads 0 dead letters with all databases reporting ("partial": false), so that’s a true zero, not a zero with a shrug.
Forty dead letters to zero, with the agent narrating what it replayed, what it didn’t and why, asking before the irreversible step, and verifying its own cleanup. The ids flow from the read tools straight into the action tools; no console tab was harmed in the making of this triage.
“What happened with message 08df07a4-…?”
As part of the effort toward building CritterWatch, we purposely improved Wolverine’s OpenTelemetry output to enable the troubleshooting we’re showing in this section.
This one’s my favorite, because it’s the question you actually ask in an incident review. Somebody hands you a message id from a log line and wants to know: where did this thing come from, what did it do, and what happened because of it?
Wolverine has emitted rich OpenTelemetry spans for years — every send, receive, and handler execution, tagged with messaging.message_id, messaging.conversation_id, messaging.message_type, the destination URI, and the handler type. CritterWatch’s trace tools sit on top of whatever tracing backend you already run (Jaeger in my dev fleet; DataDog and Application Insights providers ship in the box) through one provider abstraction, so the agent never needs to know or care which backend answers.
Me: What happened with message
08df07a4-3ded-0488-baa4-8b734d770000?Agent →
query_recent_traces("TripPublisher", requiredTags: { "messaging.message_id": "08df07a4-3ded-0488-..." })
json
{ "provider": { "name": "jaeger-dev", "providerType": "Jaeger" }, "count": 1, "traces": [{ "traceId": "a4221774888b043b0a41a4cbcbb22f72", "rootOperationName": "marten.trip.all.page.execution", "durationMs": 15.311, "spanCount": 9, "rootTags": { "database.uri": "postgresql://localhost/postgres/trips", "event.floor": "2030", "event.ceiling": "2034" } }]}
Look at that root span, because it’s telling you something genuinely interesting: this message wasn’t born in a controller or a handler. It was born inside a Marten async daemon page execution — the projection daemon chewing through events #2030–2034 on the trips database. The agent then pulled the full span tree with get_trace — spans come back flat with ParentSpanId edges, and every Wolverine span carries the semantic tags:
json
{ "spans": [ { "serviceName": "TripService", "operationName": "send", "tags": { "messaging.message_id": "08df07a4-3ded-0488-baa4-8b734d770000", "messaging.message_type": "TripMessages.ContinueTrip", "messaging.message_payload_size_bytes": "49" } }, { "serviceName": "TripPublisher", "operationName": "TripMessages.ContinueTrip", "tags": { "message.handler": "TripPublisher.ContinueTripHandler", "messaging.message_id": "08df07a4-3ded-0488-baa4-8b734d770000", "otel.status_code": "OK" } }, "... 7 more spans: the daemon page, sibling sends, sibling handler executions ..."] }
And here’s the answer the agent actually gave — the raw spans reconstructed into the story a human wants:
Agent: Here’s the full life of message
08df07a4-3ded-0488:
- Born — inside a Marten async projection daemon page on
postgresql://localhost/postgres/trips, while it processed events #2030–2034 (a 15.3ms page). This message is a consequence of event processing, not a user action.- Sent — TripService dispatched it as a
TripMessages.ContinueTripcommand over RabbitMQ (49-byte payload).- Handled —
TripPublisher.ContinueTripHandlerexecuted it on TripPublisher with statusOK.- Siblings — the same parent operation emitted three more
ContinueTripmessages in the same batch (…0474,…0514,…0100); all three were also handled successfully.So: five events were processed, four commands came out of it, all four landed cleanly across two services. Nothing about this message needs your attention.
Events appended, the message they caused, the handler that ran, and the sibling messages that rode along — the entire causal neighborhood of one message id, reconstructed from spans your system was already emitting. And when I asked the structural version of the same question — “where does ContinueTrip fit in the overall workflow?” — the agent reached for describe_lifecycle, which returns the type’s complete lifecycle stitched across every monitored service: publisher → transport → handler → cascaded messages → appended events → projections, rendered as both structured JSON and a ready-to-paste Mermaid sequence diagram. The observed instance and the structural map, side by side.
Chasing a poisoned projection
At least in the early days of Marten, this was frequently one of the hardest things to troubleshoot, but CritterWatch is going to help a great deal.
Now for the event sourcing crowd. Async projections fail in a uniquely annoying way: some event, somewhere in a stream, makes your Apply method throw, and the failure surfaces a long way from the cause. So I armed CritterWatch’s deterministic projection poison against TripService — set_chaos_monkey_projection_poison(eventTypeName: "TripStarted") — which makes every apply of that event type throw. (Why deterministic instead of the random failure-rate knob? Because with a rate, the alert, the dead-letter drill-in, and the projection stepper each land on a different random event, which is exactly what a diagnosis story can’t use. The poison makes every surface name the same event.)
Within a couple of minutes the fleet got loud, and the agent’s list_active_alerts("TripService") came back looking like a proper incident:
json
{ "alerts": [ { "severity": "Critical", "alertType": "AgentDown", "subject": "Distance:All", "message": "Projection agent for Distance:All had not sent a heartbeat for 4m 8s" }, { "severity": "Warning", "alertType": "ProjectionStale", "subject": "Distance:All", "message": "Projection Distance:All has not advanced in 5m 3s" }, { "severity": "Critical", "alertType": "MetricsDlqRate", "message": "Dead letter rate 110.0/hr (110 dead letters in the last hour)" }, "..." ] }
And the dead letter summary told the sharper story — 2,100 dead letters, every last one of them the same shape:
json
{ "totalDeadLetters": 2100, "groups": [{ "messageType": "TripMessages.TripMaintenanceCheck", "exceptionType": "JasperFx.Events.Daemon.ApplyEventException", "count": 2100 }] }
One message type, one exception type. Poison. The agent queried an envelope and the exception message pointed straight at the crime scene:
json
{ "exceptionType": "JasperFx.Events.Daemon.ApplyEventException", "exceptionMessage": "Failure to apply event #5784 Id(95dca7ce-5330-4f1d-9f18-151f91670d59)" }
Which the agent rolled up into an incident assessment I’d happily paste into a ticket as-is:
Agent: This is a poison-event pattern, not an outage. Here’s the evidence chain:
- All 2,100 dead letters are one message type (
TripMaintenanceCheck) failing with one exception type (ApplyEventException) — the opposite shape from this morning’s transient batch.- The exception is thrown by the event store’s apply pipeline, not by handler logic — each of these handlers folds the
Tripaggregate from its event stream, and the fold itself is what’s dying.- The failure names the exact event: event #5784 on stream
95dca7ce-5330-4f1d-9f18-151f91670d59, aTripStartedapply.Every incoming maintenance check is going to keep dead-lettering until the apply is fixed — replaying now would just bounce all 2,100 straight back. Recommended next step: open this stream in the projection stepper and watch the fold up to event #5784 to see exactly what state + event data the
Applymethod chokes on.
Read that middle bullet again: the agent distinguished “your handler threw” from “your aggregate fold threw” purely from the exception’s origin — which is exactly the distinction that decides where you go looking for the bug. And this is precisely the moment the projection stepper exists for: give it the projection and the stream, and it replays the events one at a time in the console, showing you the projected document’s state before and after each event — so you watch the state fold step by step right up until the apply that blows up, with the failing event’s data sitting in front of you. No more “add a Console.WriteLine to the Apply method and rebuild.”
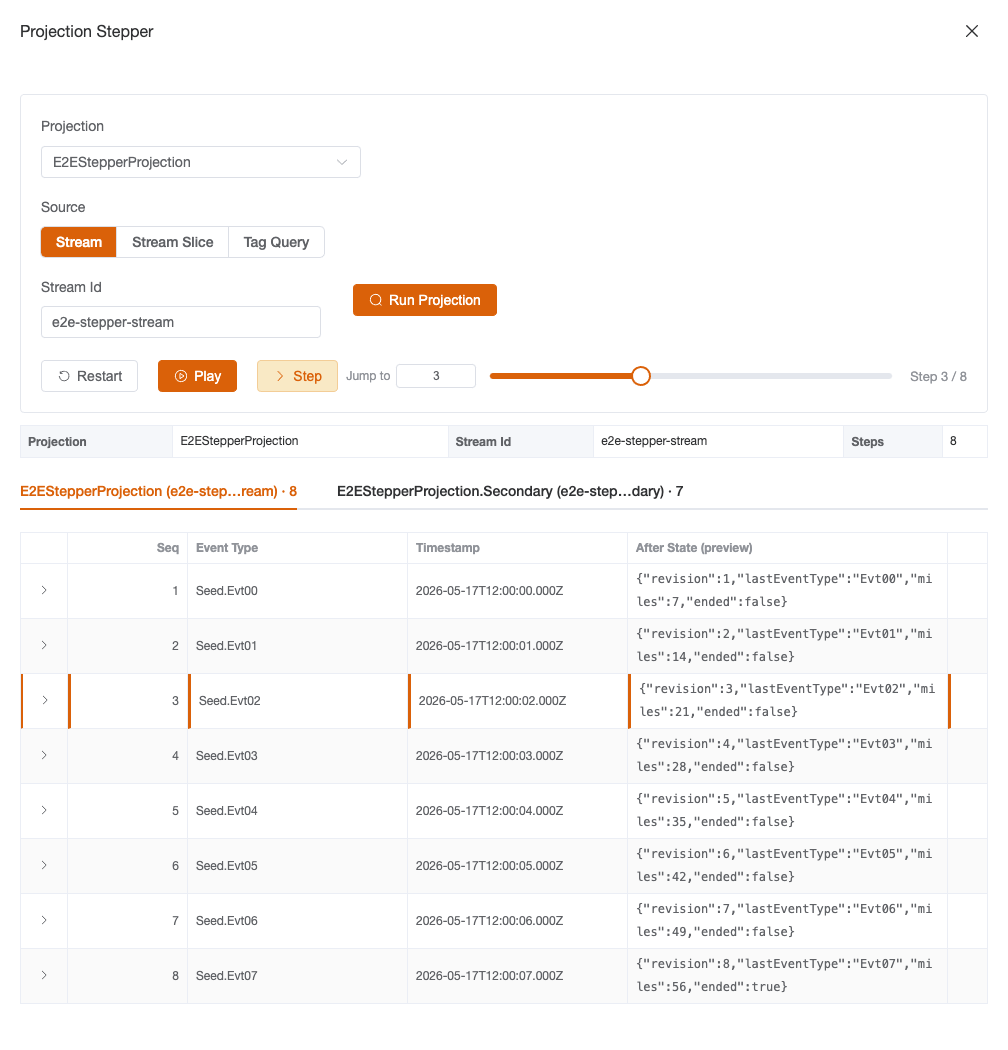
The remediation ran back through MCP, in order: clear the poison (in real life: ship the fix to your Apply method), then page through and replay all 2,100 maintenance checks — and the agent narrated its own progress as it went, so I could watch the drain without asking:
Agent: Poison cleared. Replaying the backlog in pages of 200 and confirming each drains before continuing:
All 2,100 replayed and handled successfully — the fix holds under the full backlog, not just a sample.
Then restart_projection("TripService", "Distance:All") to bounce the projection agent, whose restart command CritterWatch routes to whichever node currently owns that agent:
json
{ "accepted": true, "operation": "Restart", "serviceName": "TripService", "projectionShardName": "Distance:All", "agentUri": "event-subscription://tripservice/Distance:All" }
If the projected documents themselves had been corrupted, rebuild_projection is sitting right there in the same toolbox, per-tenant scoping included.
Interrogating the alert subsystem
The alert subsystem got exercised throughout, but it deserves its own beat. The fleet-wide rollup is a single call:
Agent →
summarize_active_alerts()
json
{ "totalActive": 11, "criticalTotal": 4, "warningTotal": 7, "byService": [ { "serviceName": "PolecatTripService", "total": 2, "critical": 2 }, { "serviceName": "HelpDesk", "total": 4, "critical": 1 }, { "serviceName": "TripService", "total": 2, "critical": 1 }, "..." ] }
Which the agent handed back as a briefing rather than a JSON blob:
Agent: 11 active alerts across 6 of your 25 services — 4 critical, 7 warnings:
Service Critical Warning PolecatTripService 2 — HelpDesk 1 3 TripService 1 1 MTTripService — 1 Trip3Service — 1 IncidentService — 1 The TripService critical is the dead-letter rate alert from this morning’s drill — that one’s explained and should decay on its own. PolecatTripService’s two criticals are the ones I’d look at next if you want to keep going.
That’s a real fleet with real background noise, not a sanitized screenshot — eleven active alerts across six services, most of them the ordinary grumbling of a dev fleet that’s been abused all afternoon. list_active_alerts filters by service or severity, get_alert drills into one, and the action side — acknowledge_alert, snooze_alert, clear_alert — flows through the same event-sourced alert streams the console UI writes to. When the agent ran acknowledge_alert("alert:TripService:MetricsDlqRate:*") on the dead-letter-rate alert (my fault, see above), that acknowledgment showed up in the console’s alert timeline like any operator action, attributed and auditable.
One alert in that list turned out to be my favorite kind of detail: a warning that TripService’s scheduled-job poller was sitting on a growing backlog of scheduled envelopes. That wasn’t chaos I’d injected — that was CritterWatch correctly flagging genuine congestion in the sample fleet’s trip lifecycle, which schedules a TripMaintenanceCheck fifteen seconds after every trip starts. The demo rig got caught by its own monitoring. I’ll take it.
Read models, tenants, and performance while we’re here
A few quick hits from the same session, because the read surface goes well past the headline acts:
get_projection_lag("TripService")returned all seven projection shards with their sequence positions, assigned nodes, agent status, pause reasons, and any captured exceptions — the projection-monitoring view as data.query_documents("TripService", "trip")paged through the 6,356 liveTripdocuments in the service’s Marten store — the document store explorer as an MCP tool, which also happily queries the daemon’sDeadLetterEventdocuments when you’re hunting skipped events.- On the multi-tenant services,
list_document_typesenumerated each tenant-sharded store’s types, and the tenant action tools —add_tenant,enable_tenant,disable_tenant, and friends — drive the same runtime tenant lifecycle the console UI does, fanned out across every registered tenant source. list_backlog_hotspotsandget_backlog_stateroll up incoming/outgoing/scheduled/dead-letter depths per store, fleet-wide, for “is anything drowning?” at a glance.
That document query deserves one concrete look, because “the agent can read your read models” is easy to skim past. Asked for a sample of live trips, it came back with:
json
{ "documentType": "trip", "totalCount": 6356, "pageSize": 3, "documents": [ { "Id": "01a0594f-8241-4049-a320-28d7bf42f04b", "State": "Oklahoma", "Active": true, "StartedOn": 40, "Traveled": 0 }, { "Id": "01a0594f-8241-408c-a0b4-1ef964434335", "State": "Missouri", "Active": true, "StartedOn": 49, "Traveled": 0 }, "..." ] }
Agent: 6,356
Tripdocuments in the store. Something worth a second look, though: the trips I sampled all show"Traveled": 0despite being active for a while — if that field is supposed to accumulate, the projection feeding it may not be receiving the travel events at all.
That last observation is the kind of thing you get for free when the entity reading your data can also reason about it — and yes, it was right: the sample fleet’s travel pipeline really was stalled behind that scheduled-message backlog the alerting had flagged. The agent connected two findings I hadn’t connected myself.
The other half: AI Skills
Here’s the thing I want to be really clear about, because I think it’s the actual strategy and not just a feature list. The MCP tools expose the live, queryable system. But a pile of tools doesn’t make an agent good at operations — an agent also needs to know the discipline. That’s what the JasperFx AI Skills are for, and the two are built as complementary halves of one story.
The skills are curated, versioned instruction sets your coding agent loads on demand — there are dozens covering Wolverine, Marten, Polecat, testing, and messaging patterns, and a set specifically for operating CritterWatch: dead-letter triage, lifecycle diagnostics, routing diagnostics, service actions, and setup. The DLQ triage skill, for instance, doesn’t just list the four tools — it teaches the loop (summarize → query → act, in that order, with the ids flowing through), teaches an agent to read grouped counts as symptoms (“many exception types across many message types reads as a dependency being down; one message type with one exception reads as a poison message”), and drills in the non-negotiable rule I mentioned earlier: an empty result with partial: true means some stores did not report — never answer “the queue is empty.” Every time the agent in this session checked databasesAnswered before declaring victory, that was the skill talking.
We hold ourselves to a standing rule internally: any time CritterWatch exposes new information through an MCP tool, the paired skill work ships with it. A tool with no skill coverage is an under-leveraged tool.
What else can the agent do?
The session above touched maybe half the catalog. The rest of the toolbox, quickly:
- Event stores and read models — the document explorer tools (
list_document_types,query_documents,get_document) across every monitored service’s store, plus the Event Store Explorer and projection stepper in the console for stream-level spelunking. - Alerts — list, summarize, drill in, acknowledge, snooze, clear; alert thresholds themselves are configurable in the console.
- Scheduled jobs — the console’s scheduled messages view tracks every service’s scheduled envelope backlog (and as you saw above, the alerting watches the poller’s drain rate for you).
- Projection monitoring and operations —
get_projection_lagfor the shard-by-shard truth, thenpause_projection/restart_projection/rebuild_projection/eject_projection, all tenant-scopable. - Performance — backlog state and hotspots fleet-wide, projection lag, plus the OpenTelemetry trace tools riding your existing Jaeger / DataDog / App Insights backend.
- Message routing —
explain_message_routinganswers “where would this message go and why?” from the actual runtime routing rules, which beats reasoning about conventions from memory every single time. - Listeners and services — pause, restart, and drain listeners; evict a defunct service from the console.
- Chaos engineering — the same chaos monkey tools I used to rig this demo: failure rates, slow handlers, deterministic projection poison, and dead-letter seeding for game days against staging.
One important word about the gates
Everything in this post is a paid-tier capability — every MCP tool checks the CritterWatch license before doing anything, and an unlicensed host answers every tool call with a polite LicenseMissing envelope rather than your production data. And beyond licensing, the action tools run through CritterWatch’s opt-in RBAC: every mutating tool is gated on a named capability (dlq.replay, dlq.discard, chaos-monkey.configure, and so on) scoped to the target service as a resource — so “the agent may replay dead letters on TripService but touch nothing on the billing service” is a policy you can actually write. Even the dead-letter reads carry their own capability, because dead letters contain message bodies, and “may look at business data” deserves a separate grant from “may act on it.” RBAC ships off by default for the low-ceremony getting-started path, and turns on when you’re ready to hand an agent real credentials in a real environment. The stateless MCP transport exists precisely so those checks always see the current caller, not whoever happened to open the session.
Handing an AI agent a control surface for production is the kind of thing that should make you a little nervous. It makes me a little nervous, and we built it — which is exactly why the license gate, the capability model, and the per-service scoping aren’t bolted on after the fact.
Epilogue: the alerts that wouldn’t clear
Dogfooding is good, and this issue is already fixed for our upcoming 1.1 release.
One loose thread, because I promised you the “wait, that’s not what I expected” moments too. Sharp-eyed readers may have noticed something off in the poisoned-projection section: those AgentDown alerts claimed the projection agents hadn’t sent a heartbeat in over four minutes — when the poison had only been armed for two. And after the remediation, they lingered longer than they should have, over a daemon that a direct SQL query showed advancing every single second.
The symptoms were real. The mechanism was not what anyone in the room — human or agent — guessed at first. Chasing it down with these same tools against CritterWatch’s own telemetry pipeline turned into a genuinely fun piece of distributed-systems forensics, complete with a Postgres deadlock storm, a docker daemon picking the worst possible moment to restart, and a feedback loop that made a merely-slow pipeline read as a dead one. We caught it entirely in the course of putting this post and its samples together, and the fix is already in for the upcoming CritterWatch 1.1 release. The full diagnosis — and what it taught us about building telemetry lanes that shed load instead of aging it — is the next post.
Summary
- CritterWatch’s MCP server is two lines of host code and a config stanza in your agent, and it exposes 48 tools across dead letters, alerts, health, performance, traces, routing, documents, projections, tenants, listeners, and chaos.
- The dead-letter loop — summarize, query, replay, discard — closes end to end without a human ferrying envelope ids around.
- “What happened with message X” is answerable from the OpenTelemetry spans Wolverine already emits, through whatever tracing backend you already run.
- When a projection sours, the agent finds the exact poisoned event from the dead-letter evidence, and the projection stepper shows you the state folding right up to the failure.
- The AI Skills teach your agent the operational discipline the tools alone can’t; the two ship as halves of one story, and the skills are bundled with CritterWatch Professional and Enterprise.
If you want to try this against your own Wolverine or Marten system:
- Docs: critterwatch.jasperfx.net — start with the quickstart and the MCP quick start
- Plans and pricing: jasperfx.net/our-products/#critterwatch-plans
- AI Skills for the Critter Stack: ai-skills.jasperfx.net — also available bundled or standalone
- CritterWatch is included in or discounted with our support plans, which is also how you get a hotline to the people who wrote all of this
And if you just want to talk it through first — reach out. Happy to set you up with a trial license.


One thought on “AI Assisted Production Support with CritterWatch”