EDIT 3/12: All these tests are fixed, and it wasn’t as bad as I’d thought it was going to be, but the extra logging and faster change code/run test under debugger cycle definitely helped.
This was meant to be a short post, or at least an easy to write post on my part, but it spilled out from integration testing and into some Storyteller mechanics, semi-advanced xUnit.Net usage, ASP.Net Core logging integration, and even a tepid defense of compositional architectures wrapped around an IoC container.
I’ve been working feverishly the past couple of months to push Jasper to a 1.0 release. As (knock on wood) the last big epic, I’ve been working on a large overhaul and redesign of the message persistence behind Jasper’s durable messaging. The existing code was fairly well covered by integration tests, so I felt confident that I could make the large scale changes and use the big bang integration tests to ensure the intended functionality still worked as designed.
I assume that y’all can guess how this has turned out. After a week of code changes and fixing any and all unit test and intermediate integration test failures, I got to the point where I was ready to run the big bang integration tests and, get this, they didn’t pass on the first attempt! I know, shocking right? Moreover, the tests involve all kinds of background processing and even multiple logical applications (think ASP.Net Core IWebHost objects) being started up and shut down during the tests, so it wasn’t exactly easy to spot the source of my test failures.
I thought it’d be worth talking about how I first stopped and invested in improving my test harness to make it faster to launch the test harness and to capture a lot more information about what’s going on in all the multithreading/asynchronous madness going on but…
First, an aside on Debugger Hell
You probably want to have some kind of debugger in your IDE of choice. You also want to be reasonably good using that tool, know how to use its features, and conversant in its supported keyboard shortcuts. You also want to try really hard to avoid needing to use your debugger too often because that’s just not an efficient way to get things done. Many folks in the early days of Agile development, including me, described debugger usage as a code or testing “smell.” And while “smell” is mostly used today as a pejorative to put down something that you just don’t like, it was originally just meant as a warning you should pay more attention to in your code or approach.
In the case of debugger usage, it might be telling you that your testing approach needs to be more fine grained or that you are missing crucial test coverage at lower levels. In my case, I’ll be looking for places where I’m missing smaller tests on elements of the bigger system and fill in those gaps before getting too worked up trying to solve the big integration test failures.
Storyteller Test Harness
For these big integration tests, I’m using Storyteller as my testing tool (think Cucumber, but much more optimized for integration testing as opposed to being cute). With Storyteller, I’ve created a specification language that lets me script out message failover scenarios like the one shown below (which is currently failing as I write this):
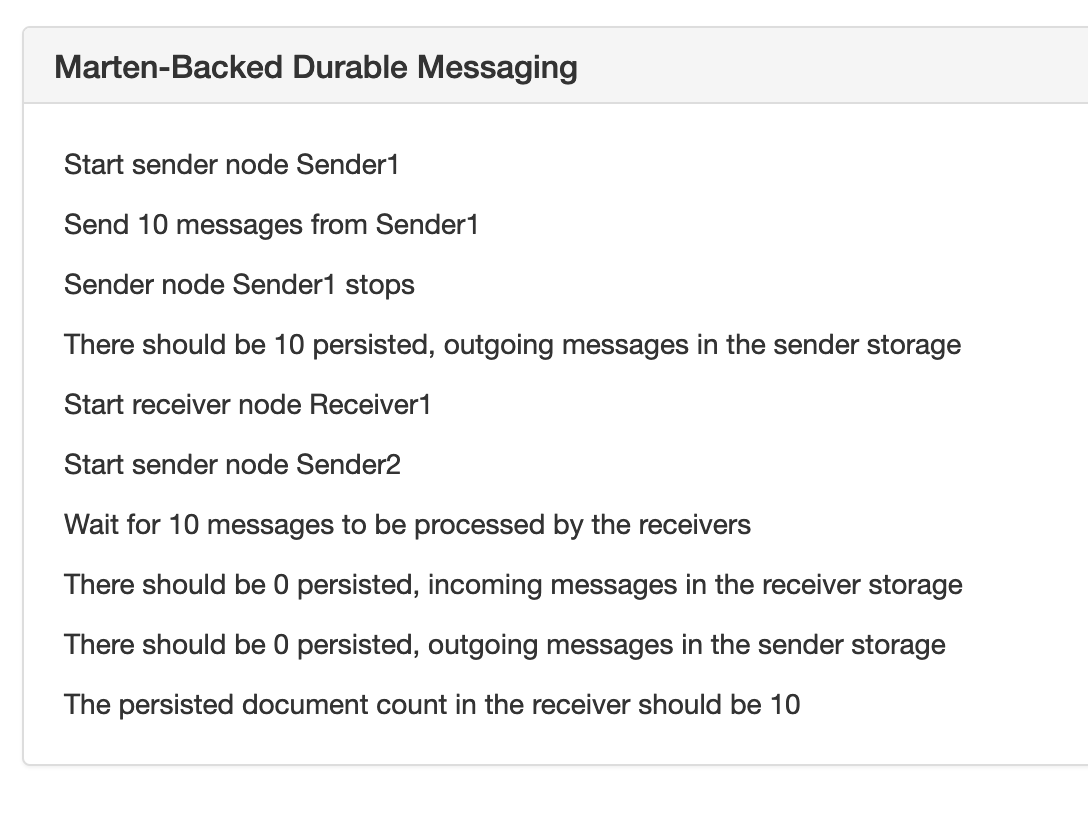
In the specification above, I’m starting and stopping Jasper applications to prove out Jasper’s ability to fail over and recover pending work from one running node to another using its Marten message persistence option. At runtime, Jasper has a background “durability agent” constantly running that is polling the database to determine if there is any unclaimed work to do or known application nodes are down (using advisory locks through Postgresql if anybody would ever be interested in a blog post about just that). Hopefully that’s enough description just to know that this isn’t particularly an easy scenario to test or code.
In my initial attempts to diagnose the failing Storyteller tests I bumped into a couple problems and sources of friction:
- It was slow and awkward mechanically to get the tests running under the debugger (that’s been a long standing problem with Storyteller and I’m finally happy with the approach shown later in this post)
- I could tell quickly that exceptions were being thrown and logged in the background processing, but I wasn’t capturing that log output in any kind of usable way
Since I’m pretty sure that the tests weren’t going to get resolved quickly and that I’d probably want to write even more of these damn tests, I believed that I first needed to invest in better visibility into what was happening inside the code and a much quicker way to cycle into the debugger. To that end, I took a little detour and worked on some Storyteller improvements that I’ve been meaning to do for quite a while.
Incorporating Logging into Storyteller Results
Jasper uses the ASP.Net Core logging abstractions for its own internal logging, but I didn’t have anything configured except for Debug and Console tracing to capture the logs being generated at runtime. Even with the console output, what I really wanted was all the log information correlated with both the individual test execution and which receiver or sender application the logging was from.
Fortunately, Storyteller has an extensibility model to capture custom logging and instrumentation directly into its test results. It turned out to be very simple to whip together an adapter for ASP.Net Core logging that captured the logging information in a way that can be exposed by Storyteller.
You can see the results in the image below. The table below is just showing all the logging messages received by ILogger within the “Receiver1” application during one test execution. The yellow row is an exception that was logged during the execution that I might not have been able to sense otherwise.

For the implementation, ASP.Net Core exposes the ILoggerProvider service such that you can happily plug in as many logging strategies as you want to an application in a combinatorial way. On the Storyteller side of things, you have the Report interface that let’s you plug in custom logging that can expose HTML output into Storyteller’s results.
Implementing that crudely came out as a single class that implements both adapter interface (here’s a gist of the whole thing):
public class StorytellerAspNetCoreLogger : Report, ILoggerProvider
The actual logging just tracks all the calls to ILogger.Log() as little model objects in memory:
public void Log<TState>(LogLevel logLevel, EventId eventId, TState state, Exception exception, Func<TState, Exception, string> formatter)
{
    var logRecord = new LogRecord
    {
        Category = _categoryName,
        Level = logLevel.ToString(),
        Message = formatter(state, exception),
        ExceptionText = exception?.ToString()
    };

    // Just keep all the log records in an in memory list
    _parent.Records.Add(logRecord);
}
Fortunately enough, in the Storyteller Fixture code for the test harness I bootstrap the receiver and sender applications per test execution, so it’s really easy to just add the new StorytellerAspNetCoreLogger to both the Jasper applications and the Storyteller test engine:
var registry = new ReceiverApp();
registry.Services.AddSingleton<IMessageLogger>(_messageLogger);

var logger = new StorytellerAspNetCoreLogger(key);

// Tell Storyteller about the new logger so that it'll be
// rendered as part of Storyteller's results
Context.Reporting.Log(logger);

// This is bootstrapping a Jasper application through the
// normal ASP.Net Core IWebHostBuilder
return JasperHost
    .CreateDefaultBuilder()
    .ConfigureLogging(x =>
    {
        x.SetMinimumLevel(LogLevel.Debug);
        x.AddDebug();
        x.AddConsole();

        // Add the logger to the new Jasper app
        // being built up
        x.AddProvider(logger);
    })

    .UseJasper(registry)
    .StartJasper();
And voila, the logging information is now part of the test results in a useful way so I can see a lot more information about what’s happening during the test execution.
It sucks that my code is throwing exceptions instead of just working, but at least I can see what the hell is going wrong now.
Get the debugger going quickly
To be honest, the friction of getting Storyteller tests running under a debugger has always been a drawback to Storyteller — especially compared to how fast that workflow is with tools like xUnit.Net that integrate seamlessly into your IDE. You’ve always been able to just attach your debugger to the running Storyteller process, but I’ve always found that to be clumsy and slow — especially when you’re trying to quickly cycle between attempted fixes and re-running the tests.
I made some attempts in Storyteller 5 to improve the situation (after we gave up on building a dotnet test adapter because that model is bonkers), but that still takes some set up time to make it work and even I have to always run to the documentation to remember how to do it. Sometime this weekend the solution for a quick xUnit.Net execution wrapper around Storyteller popped into my head and it honestly took about 15 minutes flat to get things working so that I could kick off individual Storyteller specifications from xUnit.Net as shown below:
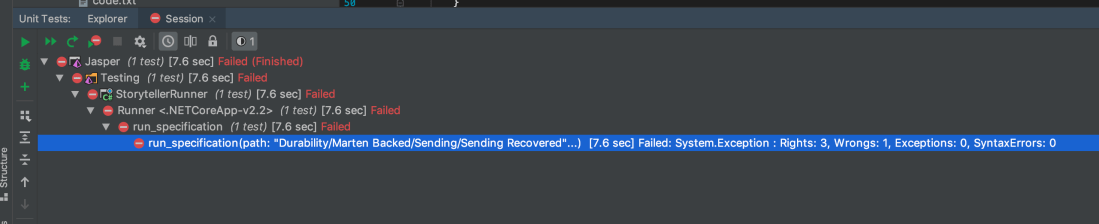
Maybe that’s not super exciting, but the end result is that I can rerun a specification after making changes with or without debugging with nothing but a simple keyboard shortcut in the IDE. That’s a dramatically faster feedback cycle than what I had to begin with.
Implementation wise, I just took advantage of xUnit.Net’s [MemberData] feature for parameterized tests and Storyteller’s StorytellerRunner class that was built to allow users to run specifications from their own code. After adding a new xUnit.Net test project and referencing the original Storyteller specification project named “StorytellerSpecs, ” I added the code file shown below in its entirety::
// This only exists as a hook to dispose the static
// StorytellerRunner that is hosting the underlying
// system under test at the end of all the spec
// executions
public class StorytellerFixture : IDisposable
{
    public void Dispose()
    {
        Runner.SpecRunner.Dispose();
    }
}

public class Runner : IClassFixture<StorytellerFixture>
{
    internal static readonly StoryTeller.StorytellerRunner SpecRunner;

    static Runner()
    {
        // I'll admit this is ugly, but this establishes where the specification
        // files live in the real StorytellerSpecs project
        var directory = AppContext.BaseDirectory
            .ParentDirectory()
            .ParentDirectory()
            .ParentDirectory()
            .ParentDirectory()
            .AppendPath("StorytellerSpecs")
            .AppendPath("Specs");

        SpecRunner = new StoryTeller.StorytellerRunner(new SpecSystem(), directory);
    }

    // Discover all the known Storyteller specifications
    public static IEnumerable<object[]> GetFiles()
    {
        var specifications = SpecRunner.Hierarchy.Specifications.GetAll();
        return specifications.Select(x => new object[] {x.path}).ToArray();
    }

    // Use a touch of xUnit.Net magic to be able to kick off and
    // run any Storyteller specification through xUnit
    [Theory]
    [MemberData(nameof(GetFiles))]
    public void run_specification(string path)
    {
        var results = SpecRunner.Run(path);
        if (!results.Counts.WasSuccessful())
        {
            SpecRunner.OpenResultsInBrowser();
            throw new Exception(results.Counts.ToString());
        }
    }
}
And that’s that. Something I’ve wanted to have for ages and failed to build, done in 15 minutes because I happened to remember something similar we’d done at work and realized how absurdly easy xUnit.Net made this effort.
Summary
- Sometimes it’s worthwhile to take a step back from trying to solve a problem through debugging and invest in better instrumentation or write some automation scripts to make the debugging cycles faster rather than just trying to force your way through the solution
- Inspiration happens at random times
- Listen to that niggling voice in your head sometimes that’s telling you that you should be doing things differently in your code or tests
- Using a modular architecture that’s composed by an IoC container the way that ASP.net Core does can sometimes be advantageous in integration testing scenarios. Case in point is how easy it was for me to toss in an all new logging provider that captured the log information directly into the test results for easier test failure resolution
And when I get around to it, these little Storyteller improvements will end up in Storyteller itself.
